The 2011 Boston Bruins Stanley Cup Championship stands as one of the most memorable and hard-fought championships in NHL history. After a 39-year drought that tested the patience and loyalty of Boston’s passionate hockey fans, the Bruins captured their sixth Stanley Cup with a resilient, physical, and ultimately dominant playoff performance that culminated in a Game 7 victory on enemy ice in Vancouver.
This comprehensive guide chronicles the complete story of the 2011 Bruins championship—from the roster construction and regular season preparation through each playoff series, the dramatic Stanley Cup Finals against Vancouver, the unforgettable Game 7 shutout, and the lasting legacy of a team that epitomized Boston hockey at its finest. We’ll also explore how hockey programs at all levels preserve championship memories through modern recognition displays.
The 2011 Stanley Cup run represents more than just another championship—it embodies the perseverance, determination, and never-say-die attitude that defines Boston sports. Facing elimination multiple times, overcoming deficits, and ultimately silencing a hostile Vancouver crowd with a dominant Game 7 performance, the Bruins wrote a championship story that resonates far beyond hockey.
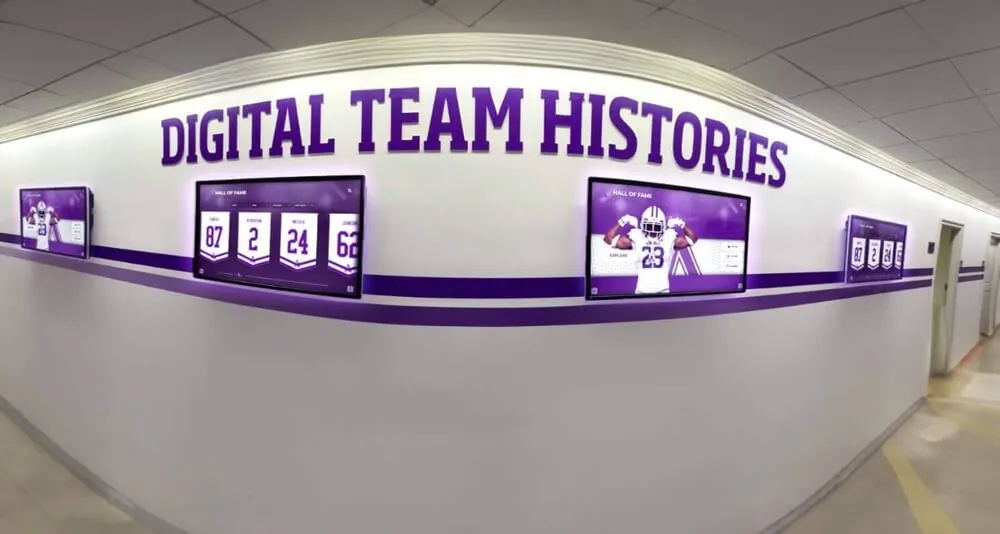
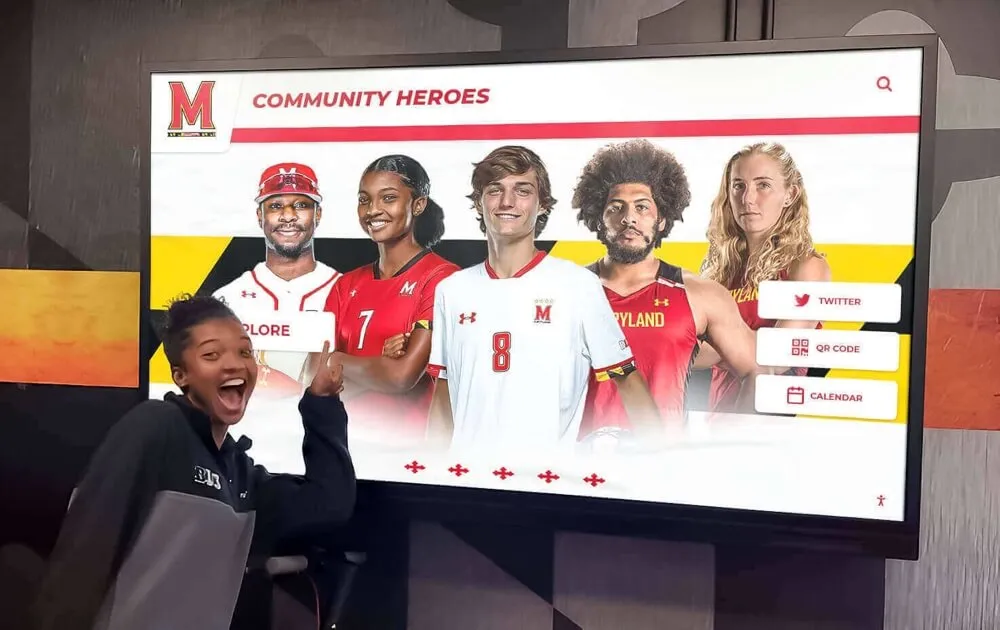
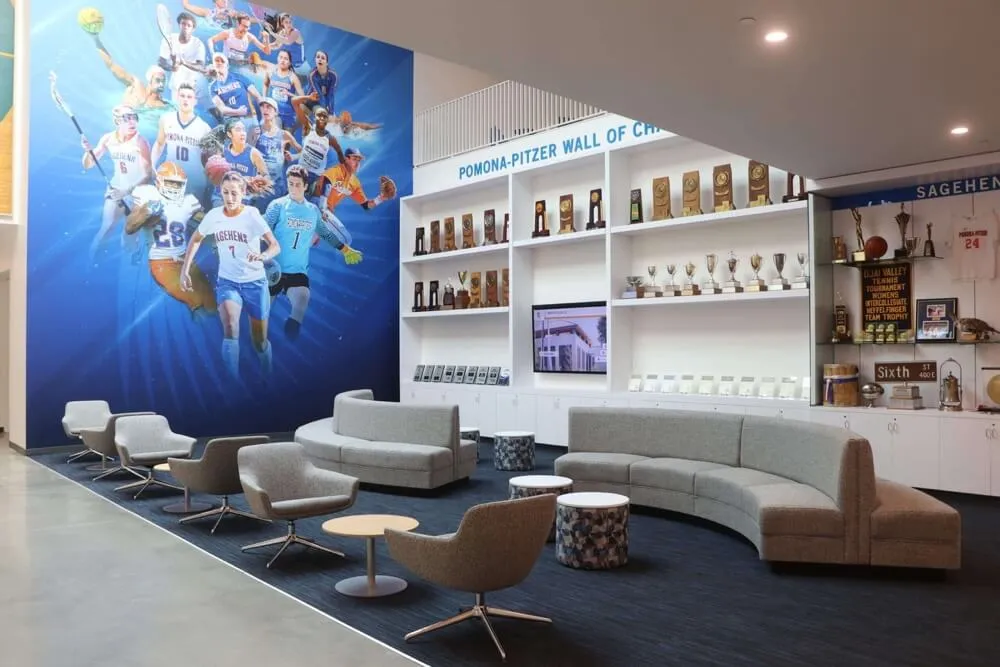
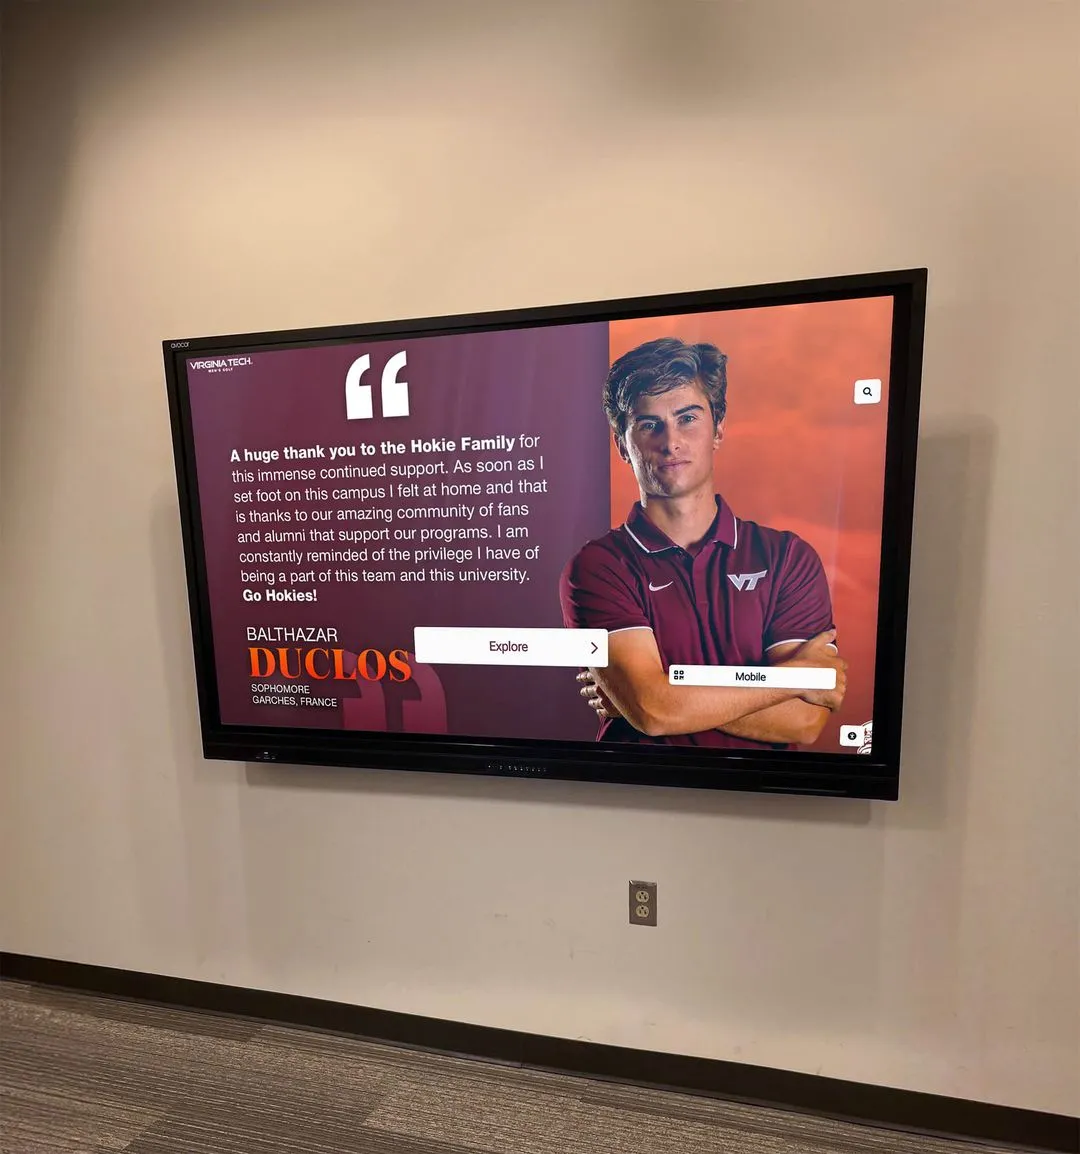
Interactive recognition displays bring championship stories to life through photos, videos, and detailed narratives
Building the Championship Foundation: Roster Construction
The 2011 championship didn’t happen by accident—it resulted from years of strategic roster building under general manager Peter Chiarelli, who assembled a team perfectly suited for playoff success.
The Core Leaders
Zdeno Chara served as captain and defensive anchor. Standing 6'9" and weighing 255 pounds, Chara provided intimidating physical presence while logging heavy minutes against opponents’ top lines. His leadership, shot-blocking willingness, and ability to shut down elite forwards proved crucial throughout the playoffs.
Patrice Bergeron emerged as the team’s most complete two-way center. Already recognized as one of hockey’s premier defensive forwards, Bergeron’s playoff performance showcased his clutch scoring ability alongside his shutdown defensive contributions. His intelligence, face-off excellence, and leadership made him indispensable.
Tim Thomas entered the playoffs as the reigning Vezina Trophy winner after posting a league-leading .938 save percentage during the 2010-11 regular season. The 37-year-old goaltender’s unorthodox style—characterized by aggressive positioning, acrobatic saves, and an almost reckless fearlessness—frustrated opponents throughout the championship run.
The Supporting Cast
The Bruins’ depth proved essential to their championship success. Brad Marchand, a third-round draft pick in 2006, transformed from a checking line player into a clutch scorer during the playoffs. David Krejci provided skilled playmaking from the second line. Milan Lucic combined size, skill, and physical intimidation on the top line.
The defensive corps featured reliable veterans like Dennis Seidenberg, Andrew Ference, and Johnny Boychuk who complemented Chara’s shutdown presence with strong two-way play. Mark Recchi, at age 43, provided veteran leadership and timely scoring in his final NHL season.
This balanced roster—combining star talent, depth scoring, defensive reliability, and elite goaltending—created a complete team capable of winning games multiple ways.
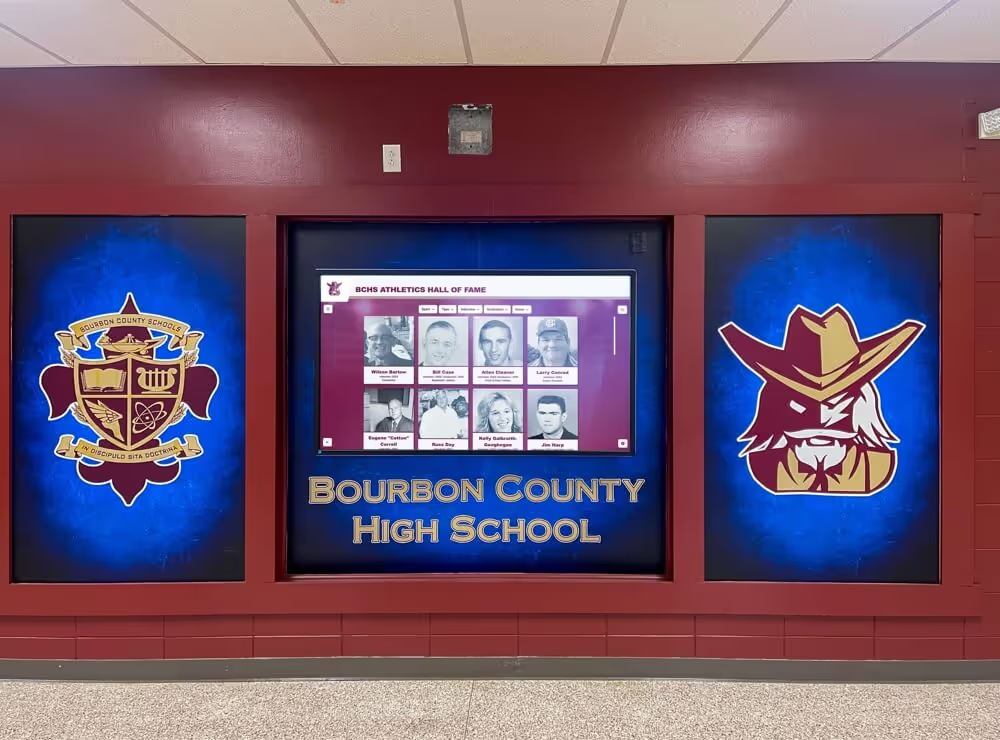
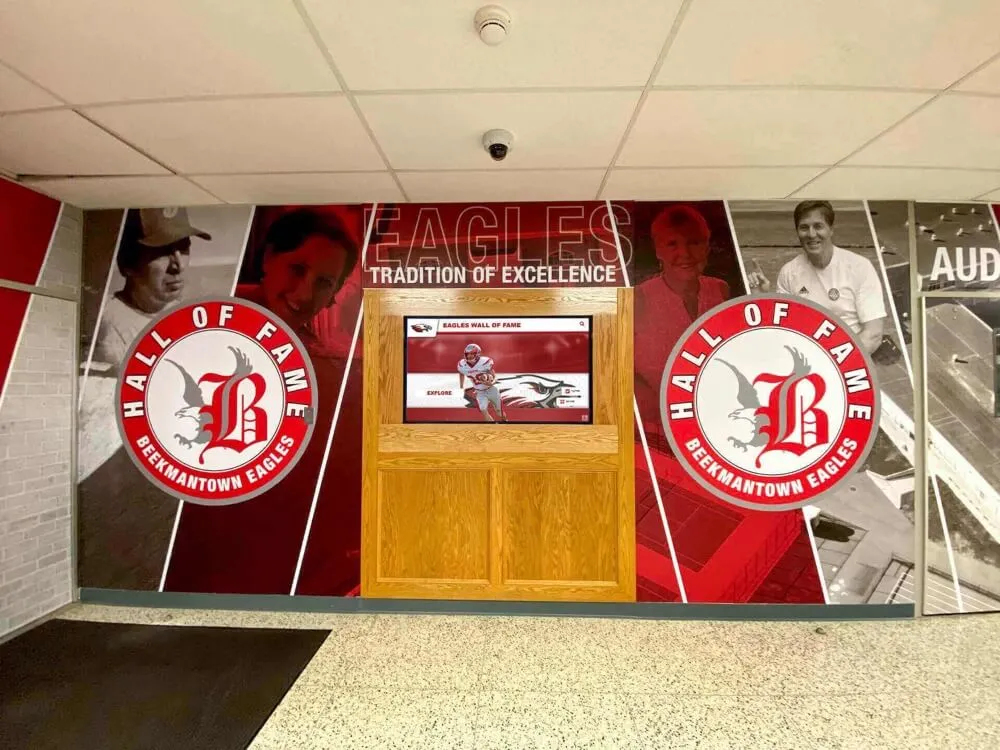
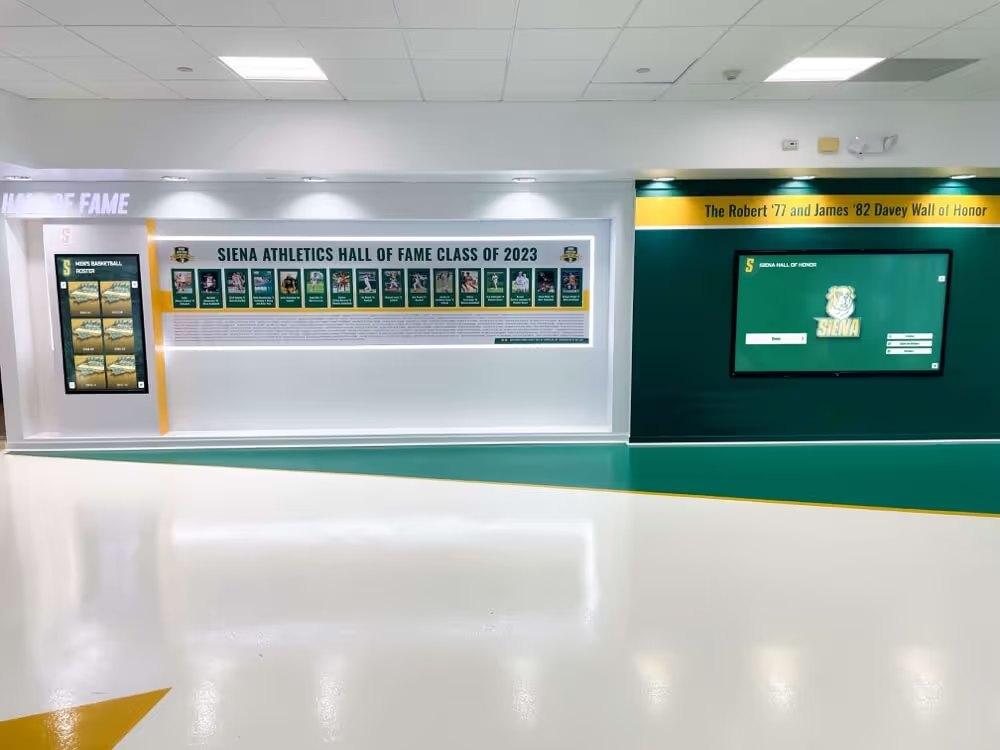
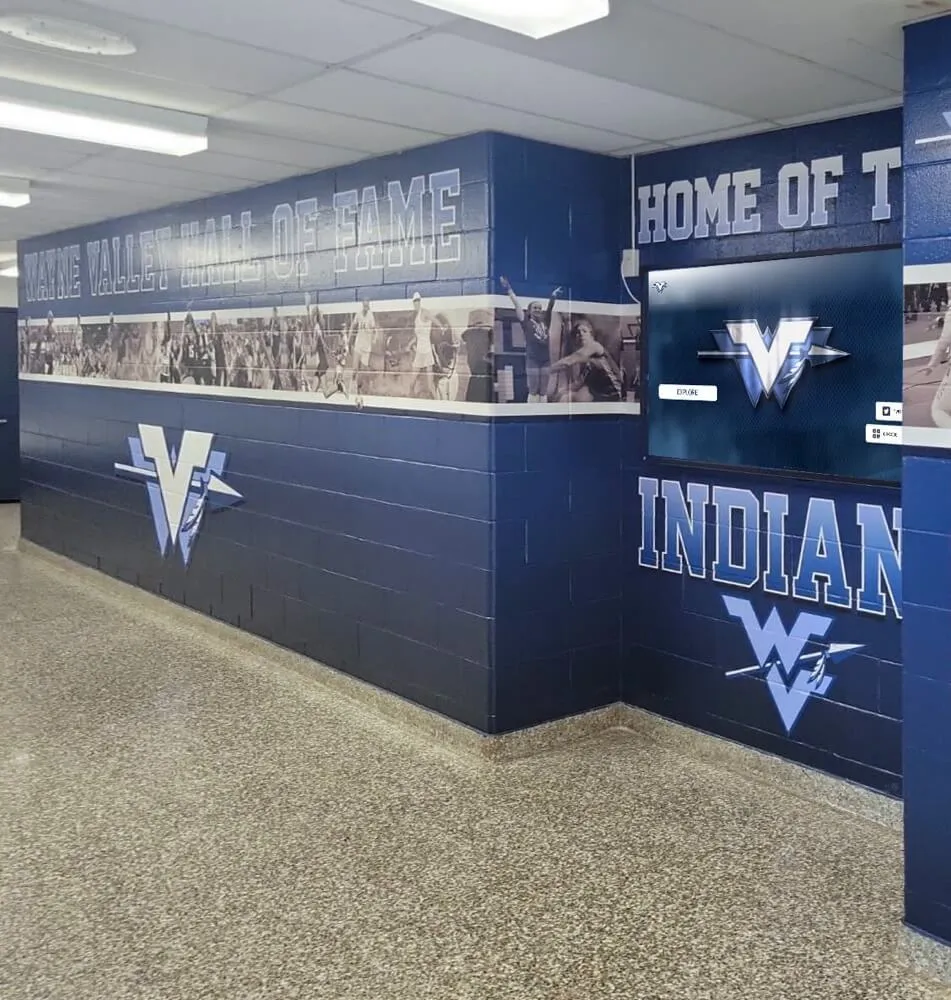
Modern displays honor entire championship rosters, not just star players
The Regular Season: Building Momentum
The 2010-11 regular season saw the Bruins finish 46-25-11 for 103 points, earning the third seed in the Eastern Conference. While the season featured strong stretches, it also included inconsistency that left some questioning whether this team possessed championship mettle.
Key Regular Season Storylines
Tim Thomas’s spectacular season earned him the Vezina Trophy as the league’s best goaltender. His .938 save percentage set an NHL record (since broken), and his 2.00 goals-against average showcased his ability to steal games.
The Bruins’ physical style, while effective, led to significant injury concerns. Throughout the season, key players missed time with various ailments, forcing depth players into expanded roles and testing the roster’s overall strength.
Coach Claude Julien emphasized defensive responsibility and structured play—principles that would prove essential during playoff hockey’s intensity. The Bruins typically kept games close, relying on stingy defense and opportunistic offense rather than high-scoring affairs.
Entering the Playoffs
Despite finishing with 103 points, the Bruins entered the playoffs without overwhelming confidence. Questions persisted about their scoring depth, their ability to handle pressure, and whether this core group could finally break through after previous playoff disappointments.
The playoffs would answer these questions definitively, as Boston transformed into a relentless, confident group that grew stronger with each series.
Round One: Defeating Montreal (4-3)
The Bruins opened the playoffs against their archrivals, the Montreal Canadiens, in a series that immediately tested Boston’s championship resolve.
The Series That Launched a Run
Boston took Game 1 in overtime, 2-0, with Tim Thomas making 31 saves for the shutout. However, Montreal responded with consecutive victories, putting Boston in a precarious 2-1 series hole that had some doubting whether this team was truly ready for championship contention.
Game 4 proved pivotal. Facing potential elimination at home, the Bruins dominated Montreal 5-4 in overtime, with Recchi scoring the winner to even the series. This victory shifted momentum decisively—Boston wouldn’t trail in another series the entire postseason.
The teams split the next two games, forcing a Game 7 at TD Garden. In the deciding game, Boston delivered a comprehensive 4-3 victory, advancing past their bitter rivals and establishing the resilient identity that would define their championship run.
Key Takeaways
The Montreal series taught Boston valuable lessons about playoff hockey. They learned to handle adversity, respond to deficits, and maintain composure under pressure. These experiences proved invaluable in later rounds when facing elimination situations.
Nathan Horton’s emergence as a clutch playoff scorer began in this series, providing secondary scoring that complemented the top line’s contributions. For programs celebrating playoff performance across all sports, championship recognition displays ensure these defining moments receive lasting commemoration.

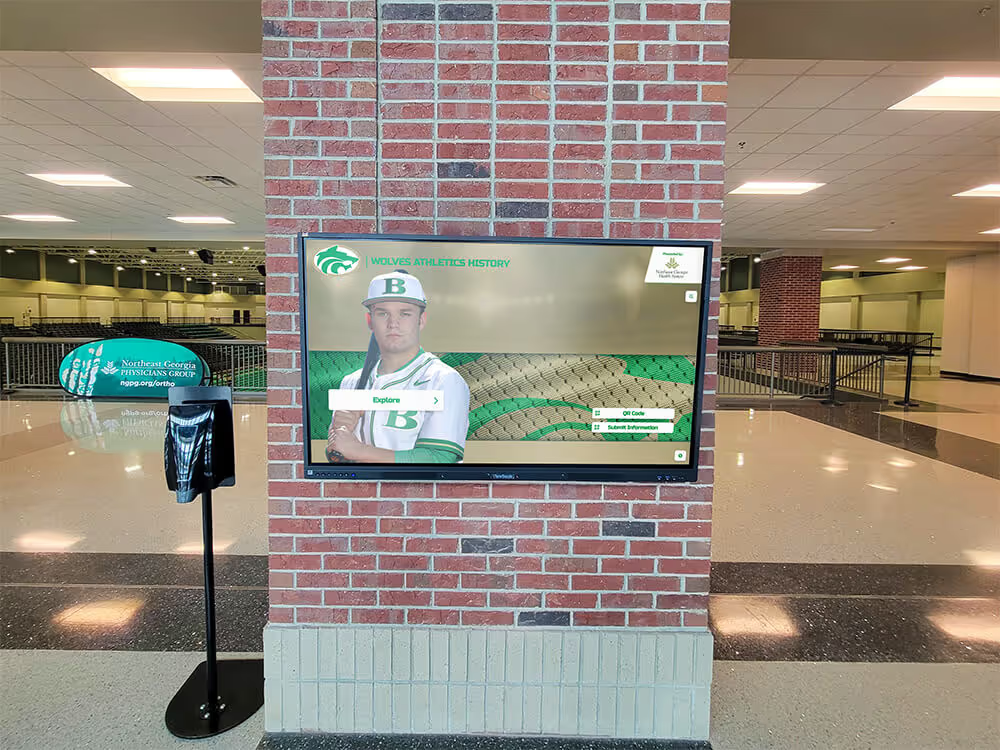
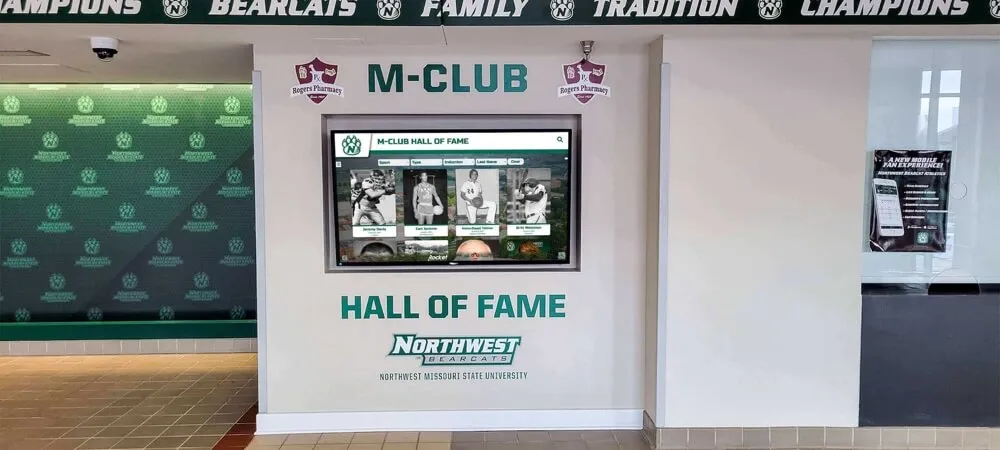
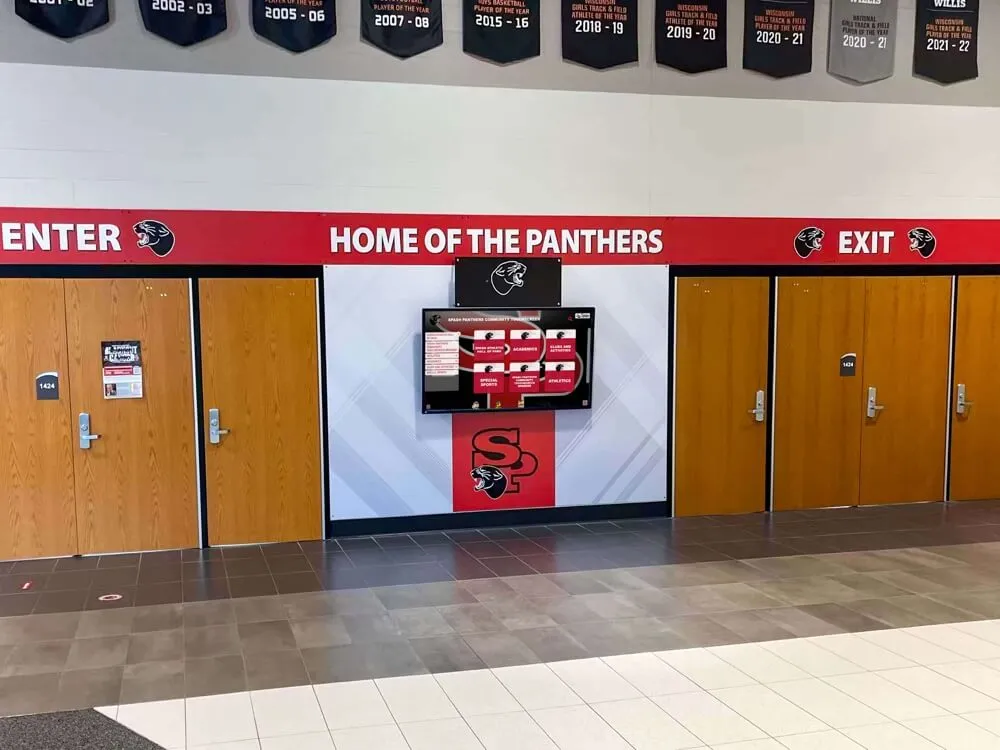
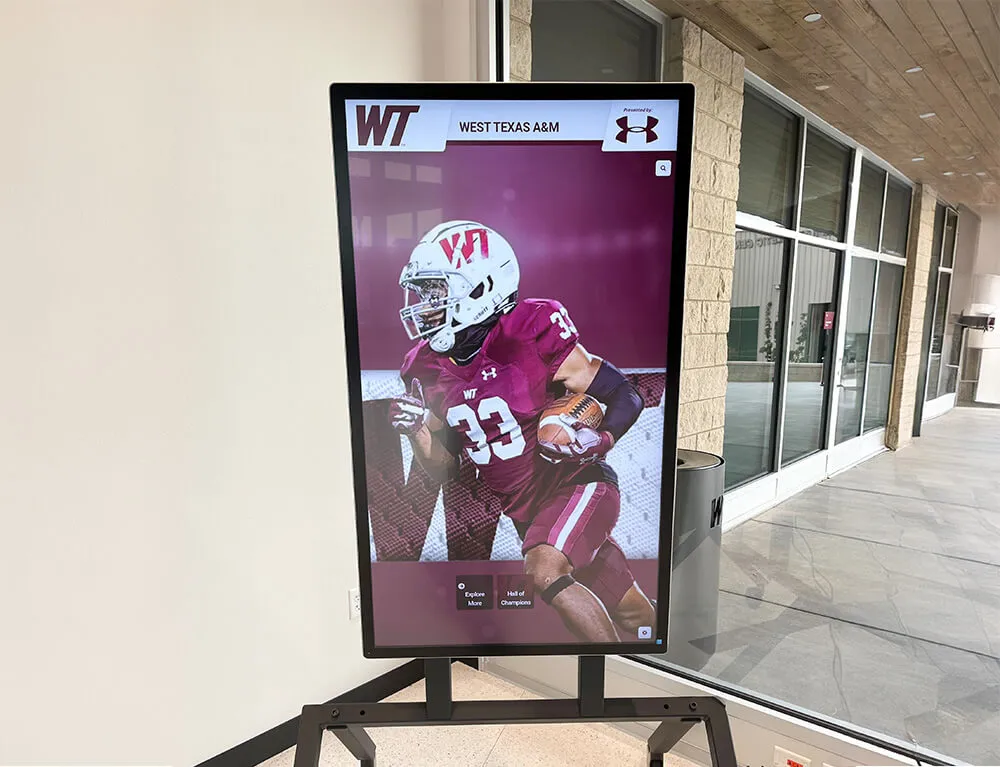
Interactive displays showcase playoff brackets, series results, and defining moments
Round Two: Sweeping Philadelphia (4-0)
After the grueling Montreal series, Boston faced the Philadelphia Flyers—a team that had embarrassed the Bruins with a historic comeback from a 3-0 series deficit the previous year.
Redemption and Dominance
The Bruins opened with consecutive 7-3 and 3-2 victories in Philadelphia, immediately establishing dominance. Game 3 at TD Garden featured another strong 5-1 victory, putting Boston one win from eliminating the team that had haunted them a year earlier.
Game 4 delivered the sweep with a 5-1 victory, avenging the previous year’s collapse and demonstrating how much this team had grown. The series showcased Boston’s balanced attack—seven different players scored goals across the four games, illustrating the depth that made this team so difficult to defend.
Thomas’s Excellence
Tim Thomas’s performance against Philadelphia foreshadowed his eventual Conn Smythe Trophy-winning playoff. He made timely saves to preserve leads and showed remarkable poise handling Philadelphia’s aggressive forechecking and physical play.
The sweep provided Boston with valuable rest before the Conference Finals while building confidence that this team possessed the completeness necessary for championship contention.
Conference Finals: Outlasting Tampa Bay (4-3)
The Eastern Conference Finals against the Tampa Bay Lightning produced one of the playoffs’ most memorable series, featuring overtime thrillers, comebacks, and clutch performances that defined championship hockey.
A Battle of Attrition
Tampa Bay, led by Steven Stamkos and Martin St. Louis, provided a completely different challenge than Montreal’s grit or Philadelphia’s physicality. The Lightning featured speed, skill, and dangerous offensive weapons that tested Boston’s defensive structure.
The series featured remarkable parity. Five of the seven games required overtime, showcasing how evenly matched these teams were. Game 1 went to Boston 5-2, but Tampa responded with a 5-4 overtime victory in Game 2.
The Turning Point
Game 7 at TD Garden would determine the Eastern Conference champion. After Nathan Horton was knocked out of the series with a concussion from a devastating hit by Aaron Rome in Game 3, the Bruins played with added determination to honor their fallen teammate.
Boston won Game 7 by a 1-0 score, with Nathan Horton—having recovered sufficiently to return—scoring the game’s only goal. Tim Thomas made 24 saves for the shutout, delivering when the stakes couldn’t have been higher.
The victory sent Boston to their first Stanley Cup Finals since 1990, setting up a championship showdown with the Vancouver Canucks.
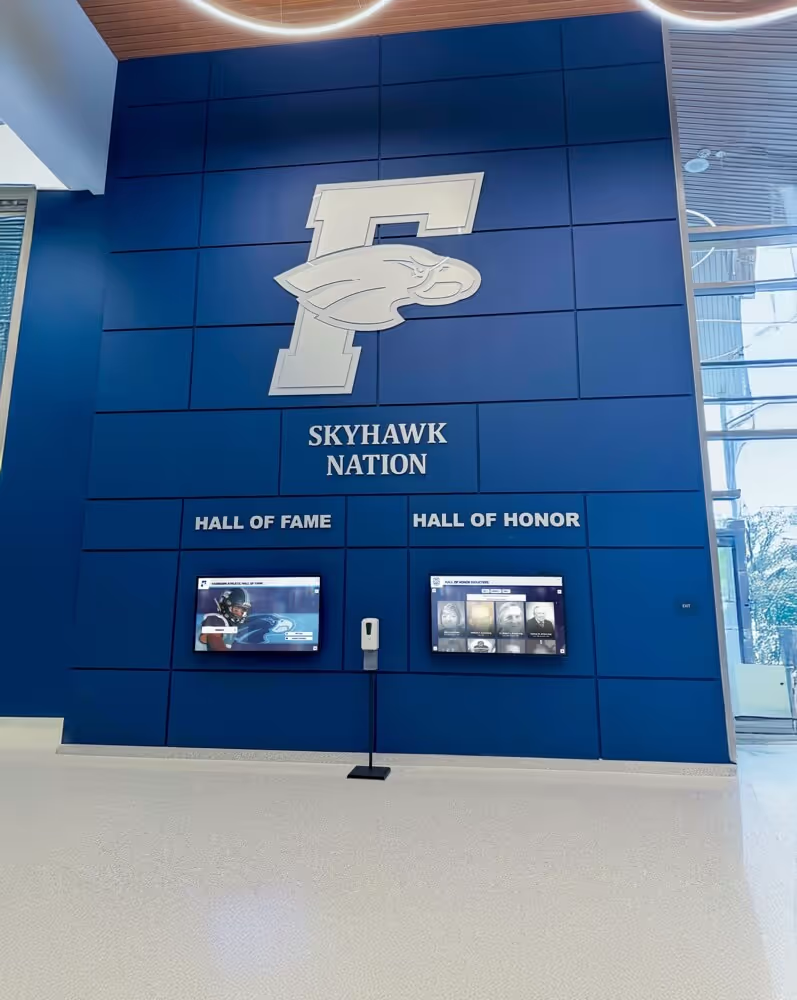
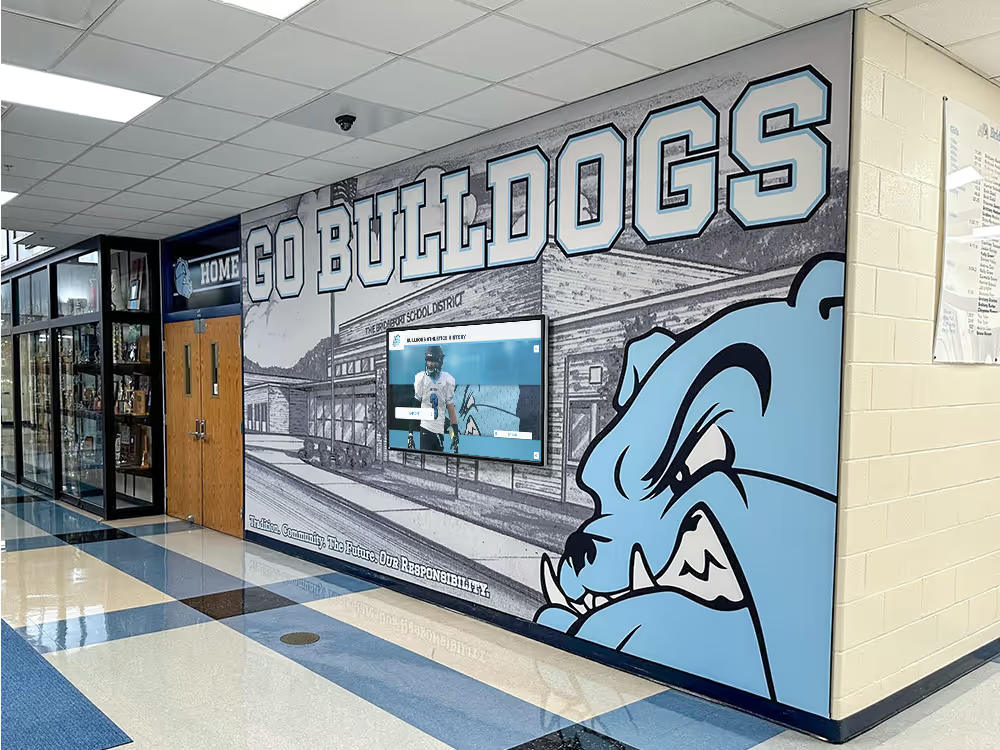
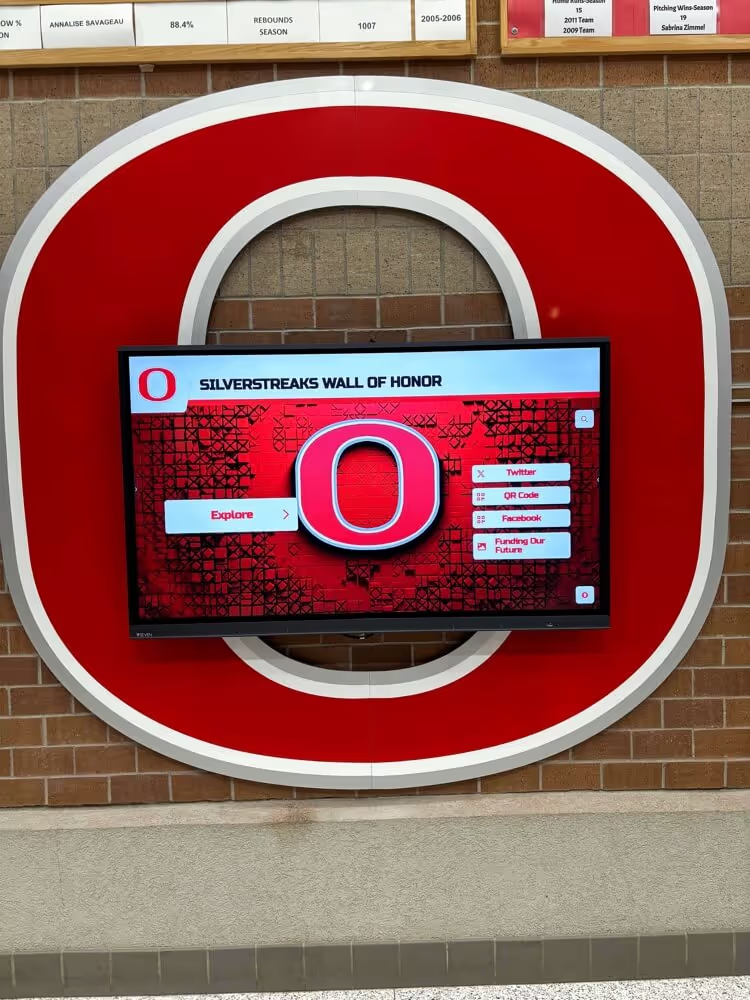
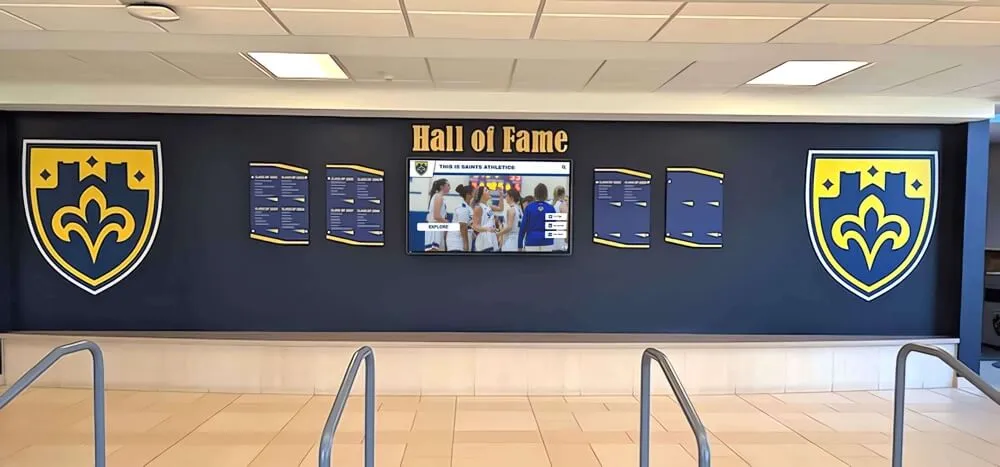
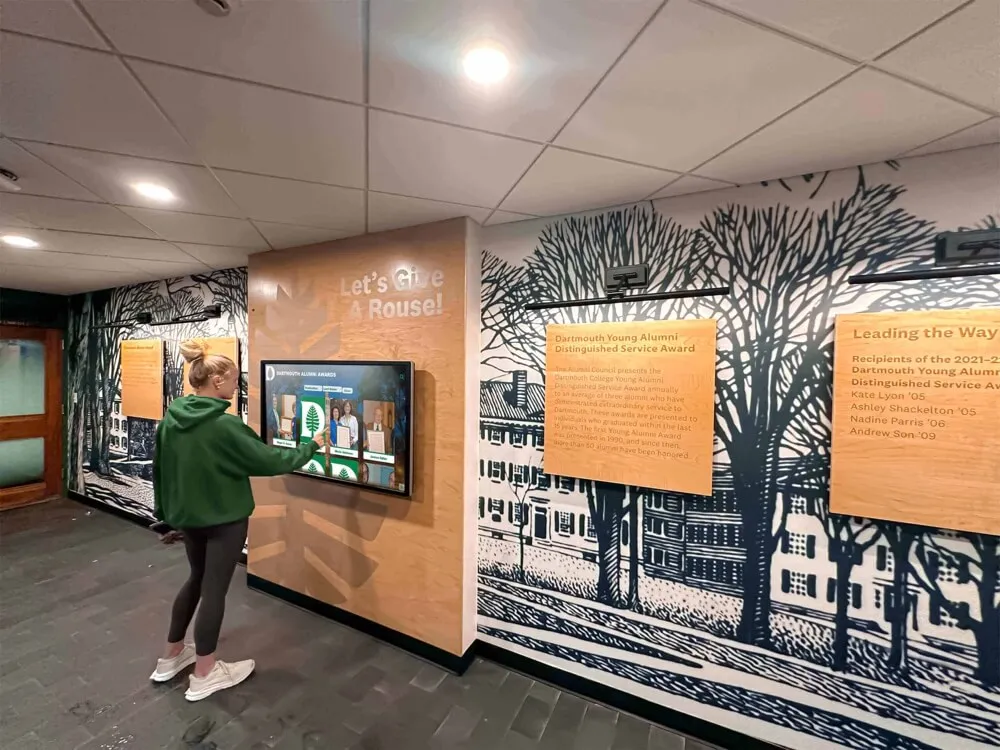
Comprehensive displays preserve complete playoff narratives, not just final results
The Stanley Cup Finals: Boston vs. Vancouver
The Stanley Cup Finals matched two teams with contrasting styles and philosophies—Vancouver’s speed and skill versus Boston’s physicality and defensive structure.
The Contrasting Styles
Vancouver finished the regular season with the NHL’s best record (117 points) and featured the league’s most potent offense led by the Sedin twins (Henrik and Daniel), Ryan Kesler, and Alex Burrows. Their fluid, fast-paced style emphasized puck possession and creating odd-man rushes.
Boston countered with physical intensity, shot-blocking commitment, and defensive structure that frustrated skilled opponents. The Bruins believed they could neutralize Vancouver’s speed with aggressive forechecking and physical play.
Games 1-2: Vancouver’s Home Dominance
The series opened in Vancouver, where the Canucks leveraged home-ice advantage to take both games. Game 1 saw Vancouver win 1-0 in a defensive battle, while Game 2 featured a 3-2 Canucks victory in an intense, physical contest.
Returning to Boston facing a 2-0 series deficit, the Bruins needed to respond—and they did emphatically.
Games 3-4: Boston’s Ferocious Response
Game 3 at TD Garden produced one of the series’ most dominant performances. Boston crushed Vancouver 8-1, delivering the kind of physical, overwhelming performance that exemplified Bruins hockey. The victory announced that Boston wouldn’t surrender easily.
Game 4 continued the home dominance with a 4-0 shutout victory. Tim Thomas made 38 saves, and Boston’s physical play visibly wore on Vancouver’s skill players. The series stood tied 2-2, with momentum firmly in Boston’s favor.
For schools and programs celebrating championship moments, digital banner recognition displays provide modern alternatives to traditional fabric banners while offering multimedia storytelling capabilities.
Game 5: Vancouver Stays Alive
Returning to Vancouver, the Canucks needed to stem Boston’s momentum. In a tight 1-0 victory, Vancouver’s Maxim Lapierre scored the game’s only goal, putting the Bruins one loss from elimination.
The victory set up a potentially clinching Game 6 at TD Garden—where Boston would need to extend the series one more game.

Interactive recognition presents complete championship stories rather than just final scores
Game 6: Forcing Game 7
With their season on the line at TD Garden, the Bruins delivered a commanding 5-2 victory to force Game 7 back in Vancouver. Brad Marchand scored twice, while Recchi, Lucic, and Michael Ryder added goals in a balanced offensive performance.
The victory set up the ultimate pressure situation—Game 7 in Vancouver’s hostile Rogers Arena, where the Canucks would have home-ice advantage and overwhelming crowd support.
The Pressure Mounts
Game 7 scenarios don’t come with more pressure than facing elimination on enemy ice for a championship. The Bruins would need to silence a raucous Vancouver crowd, handle the enormous stakes, and deliver their best performance when it mattered most.
For Boston’s players, the opportunity was clear—win one more game and capture the franchise’s first championship since 1972. Lose, and face an offseason of regret and what-ifs.
Game 7: Championship Glory
June 15, 2011, produced one of the most dominant Game 7 performances in Stanley Cup Finals history, as Boston defeated Vancouver 4-0 to capture the championship.
A Masterful Performance
From the opening puck drop, Boston controlled the game. They scored twice in the first period—Patrice Bergeron at 14:37 and Brad Marchand at 17:35—to take a 2-0 lead and silence the Vancouver crowd.
The second period saw Boston add another goal by Marchand at 12:13, extending the lead to 3-0 and effectively ending Vancouver’s championship hopes. Bergeron scored again in the third period at 17:03, cementing the 4-0 final score.
Tim Thomas’s Shutout
Tim Thomas delivered a spectacular 37-save shutout performance, stonewalling every Vancouver scoring opportunity. His positioning, reflexes, and utter refusal to allow a goal provided the foundation for Boston’s championship celebration.
Thomas’s playoff performance earned him the Conn Smythe Trophy as playoff MVP—finishing with a .940 save percentage and 1.98 goals-against average across 25 games. His goaltending proved the difference throughout the playoffs, particularly in elimination situations where he was virtually unbeatable.
The Celebration
As the final seconds ticked away, Bruins players and coaches celebrated one of hockey’s most impressive championship runs. The sight of Boston’s players celebrating on Vancouver’s ice—after silencing a hostile crowd with a dominant shutout victory—created an iconic image that defined this team’s resilience and determination.
Zdeno Chara received the Stanley Cup from NHL Commissioner Gary Bettman and embarked on the traditional Cup celebration, skating the trophy around Rogers Arena while Boston fans who made the trip to Vancouver celebrated wildly.
The championship parade days later in Boston drew over one million fans, showcasing the deep emotional connection between this team and the city it represented.

Digital displays showcase championship photos, video highlights, and celebration moments
The Championship Legacy
The 2011 Bruins championship created a legacy that extends far beyond the victory itself, influencing Boston sports culture and providing a blueprint for future success.
Individual Achievements
Tim Thomas’s Conn Smythe Trophy performance ranks among the greatest goaltending playoff runs in NHL history. His .940 save percentage and ability to deliver in elimination games created a standard for playoff excellence.
Brad Marchand’s emergence as a clutch playoff performer began in this run. His 11 goals led all playoff scorers, announcing his arrival as an elite offensive threat despite his undersized frame.
Patrice Bergeron’s complete two-way performance showcased why he would go on to win six Selke Trophies as the league’s best defensive forward. His ability to shut down opponents while contributing offensively proved invaluable.
Team Identity Established
The 2011 championship established an identity for Bruins hockey that persists today—physical, defensively responsible, clutch in pressure situations, and utterly committed to team success above individual achievement.
This identity attracts certain types of players who embrace physical play, defensive responsibility, and team-first mentality. It creates organizational culture that values the same principles that delivered the 2011 championship.
For programs seeking to establish their own identities, creating comprehensive recognition displays helps communicate values and traditions that define organizational culture.
Ending the Drought
Most importantly, the 2011 championship ended a 39-year drought that had tested Boston fans’ patience. For younger fans, it provided their first championship memory. For older fans who remembered the Bobby Orr era, it validated decades of loyalty through disappointing playoff exits.
The championship proved that perseverance matters, that building complete teams wins championships, and that Boston hockey’s physical, determined style remains effective in the modern game.
Preserving Championship Memories Through Recognition Displays
While professional championships like the 2011 Bruins receive extensive media coverage and commemoration, youth hockey programs, high school teams, and amateur organizations face challenges preserving their own championship memories.
The Challenge of Traditional Recognition
Traditional trophy cases and static plaques provide limited space for championship recognition. A typical trophy case might display:
- The championship trophy itself
- A team photo
- Perhaps a plaque with player names and season record
This minimal recognition fails to capture the complete championship story—the playoff journey, individual contributions, defining moments, and emotional significance that make championships special.
Digital Recognition Solutions
Modern interactive hockey displays provide comprehensive championship recognition capabilities that traditional displays cannot match:
Complete Playoff Documentation: Digital platforms can showcase entire playoff brackets, series results, game-by-game statistics, and scoring summaries that tell the complete championship story.
Individual Recognition: Rather than just listing names, digital displays can include player profiles with statistics, positions, photos, and individual achievements from the championship run.
Multimedia Storytelling: Video highlights from key games, photo galleries from championship celebrations, and audio interviews with coaches and players bring championships to life in ways static displays never can.
Historical Context: Digital platforms can place championships within program history—showing how this team compared to previous champions, which records were set, and how the achievement fits into organizational legacy.
Engaging Current Athletes
Championship recognition serves dual purposes—honoring past achievements while inspiring current athletes. When today’s players explore digital displays and discover:
- Complete championship rosters and statistics
- Playoff performances that led to titles
- Records set during championship runs
- Photos of championship celebrations
These discoveries create powerful motivational connections. Current athletes understand that their own championship efforts will receive similar comprehensive recognition, inspiring excellence and creating emotional connections to program traditions.
Solutions like Rocket Alumni Solutions provide purpose-built platforms designed specifically for sports recognition, offering the comprehensive functionality needed to properly honor championship achievements across all competitive levels.
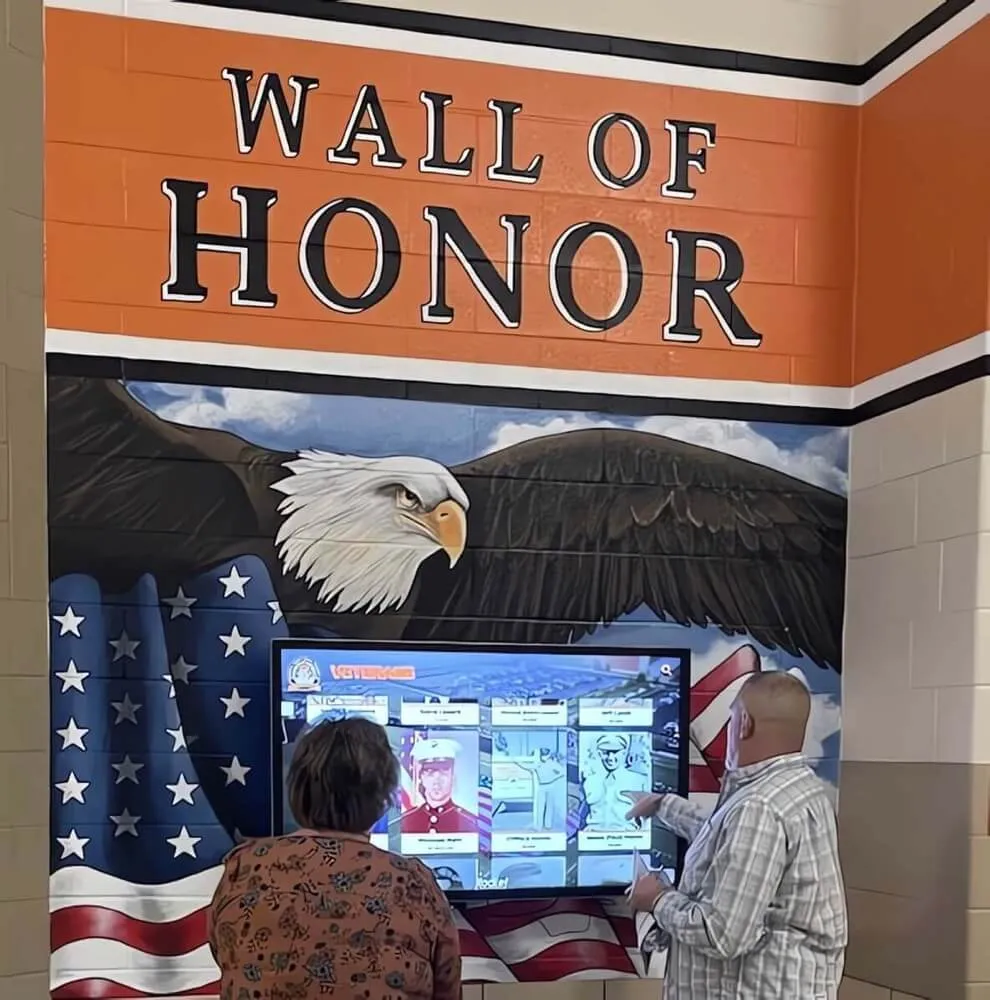
Interactive recognition ensures championship stories remain accessible to future generations
Lessons from the 2011 Bruins Championship
The 2011 championship run offers valuable lessons for teams and organizations at all competitive levels pursuing excellence.
Complete Teams Win Championships
The Bruins didn’t rely solely on superstars—they won with balanced contributions across the roster. Role players like Shawn Thornton, Gregory Campbell, and Daniel Paille made crucial contributions despite limited ice time.
Organizations pursuing championships benefit from developing depth rather than depending exclusively on star talent. Every player matters in playoff situations where injuries, fatigue, and adversity test roster completeness.
Resilience Matters
Boston faced elimination or potential elimination multiple times—Game 7 against Montreal, multiple overtime games against Tampa Bay, and the championship series itself. Their ability to respond to adversity rather than folding under pressure proved decisive.
Building mentally tough athletes and fostering resilient organizational culture creates competitive advantages when facing high-pressure situations.
Defense and Goaltending Win Playoffs
While offense attracts attention, the Bruins won primarily through elite goaltending and stingy defense. Tim Thomas’s spectacular performance and the team’s commitment to shot-blocking and defensive structure frustrated opponents throughout the playoffs.
Programs emphasizing defensive fundamentals and goaltender development create foundations for playoff success that often prove more reliable than high-scoring offenses.
Team-First Culture
The Bruins succeeded because every player embraced his role without ego or selfishness. Veterans like Recchi and Ference accepted reduced minutes. Young players like Marchand contributed wherever needed. Stars like Bergeron and Chara led by example rather than demanding special treatment.
Creating team-first culture where individual egos subordinate to collective goals remains essential for sustained excellence.
For programs building their own traditions, comprehensive sports recognition programs help communicate values and celebrate athletes who embody desired cultural attributes.
Statistical Breakdown: The Numbers Behind the Championship
The 2011 playoff run produced remarkable statistical achievements that highlight Boston’s dominance:
Team Statistics
- Overall Record: 16-9 (with 7 overtime games)
- Goals For: 73 (2.92 per game)
- Goals Against: 57 (2.28 per game)
- Power Play: 16.8% (13-for-77)
- Penalty Kill: 85.7% (78-for-91)
- Road Record: 10-4 (exceptional for playoff success)
Individual Leaders
Scoring:
- Brad Marchand: 11 goals, 8 assists (19 points)
- David Krejci: 12 goals, 11 assists (23 points)
- Patrice Bergeron: 6 goals, 14 assists (20 points)
Goaltending (Tim Thomas):
- Record: 16-9
- Goals Against Average: 1.98
- Save Percentage: .940
- Shutouts: 4
These numbers demonstrate the balanced contributions and elite goaltending that powered Boston’s championship.
Conclusion: A Championship That Defined an Era
The 2011 Boston Bruins Stanley Cup Championship represents playoff hockey at its finest—combining skill, physical intensity, resilience, and clutch performances into a championship story that will be celebrated for generations.
From building the roster through strategic acquisitions and draft picks, to surviving early-round adversity against Montreal, to dominating Philadelphia with a sweep, to outlasting Tampa Bay in an overtime-filled thriller series, to ultimately conquering Vancouver with a Game 7 shutout on enemy ice—every chapter of the 2011 story showcases the qualities that define championship teams.
The legacy extends beyond the championship itself. The 2011 team established an identity for Bruins hockey that persists today, influenced organizational culture, provided a blueprint for future success, and ended a championship drought that had tested Boston fans’ patience for nearly four decades.
For hockey programs at all levels, the 2011 Bruins offer lessons about building complete teams, fostering resilient culture, embracing defensive responsibility, and maintaining team-first attitudes that subordinate individual egos to collective success. And for organizations seeking to honor their own championship achievements, modern digital hall of fame displays ensure these special moments receive comprehensive recognition that traditional displays cannot provide.
Celebrate Your Hockey Program's Championships
Discover how modern digital recognition displays can help your organization preserve championship memories, honor team achievements, and inspire future generations with comprehensive storytelling capabilities.
Explore Recognition SolutionsThe 2011 Bruins championship proves that perseverance, complete team building, and unwavering commitment to excellence can overcome any obstacle—even 39-year championship droughts. Their story continues inspiring hockey players and fans, reminding everyone that championships aren’t won with individual brilliance alone, but through complete team efforts where every player contributes to collective success.
Whether preserving professional championships like the 2011 Bruins or celebrating youth hockey tournament victories, thoughtful recognition demonstrates that excellence matters and ensures those who contribute to building traditions receive the acknowledgment they deserve. Learn more about comprehensive hockey recognition systems designed specifically for programs at all competitive levels.