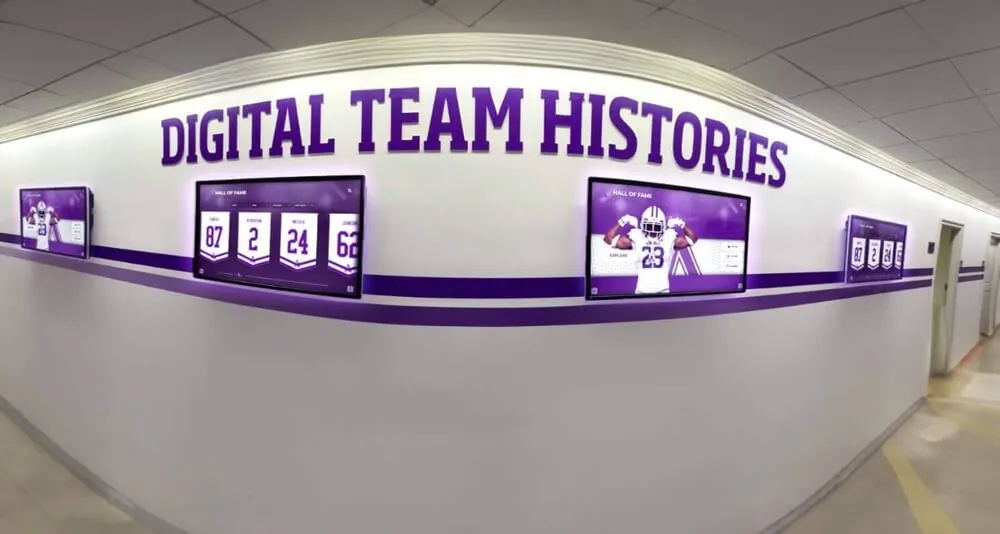
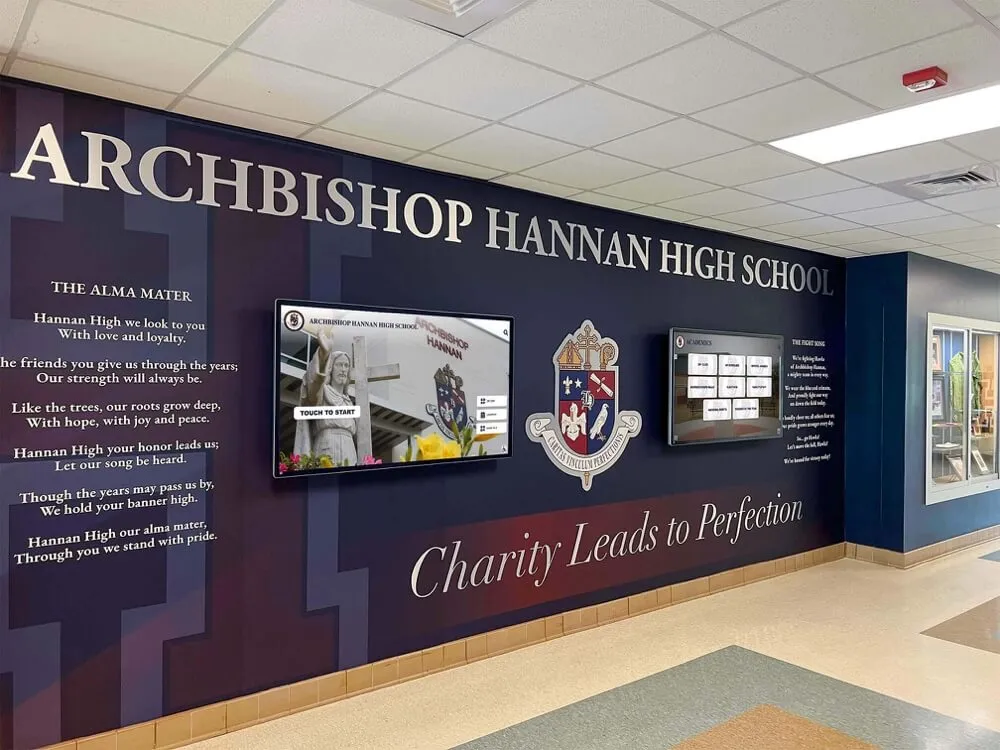
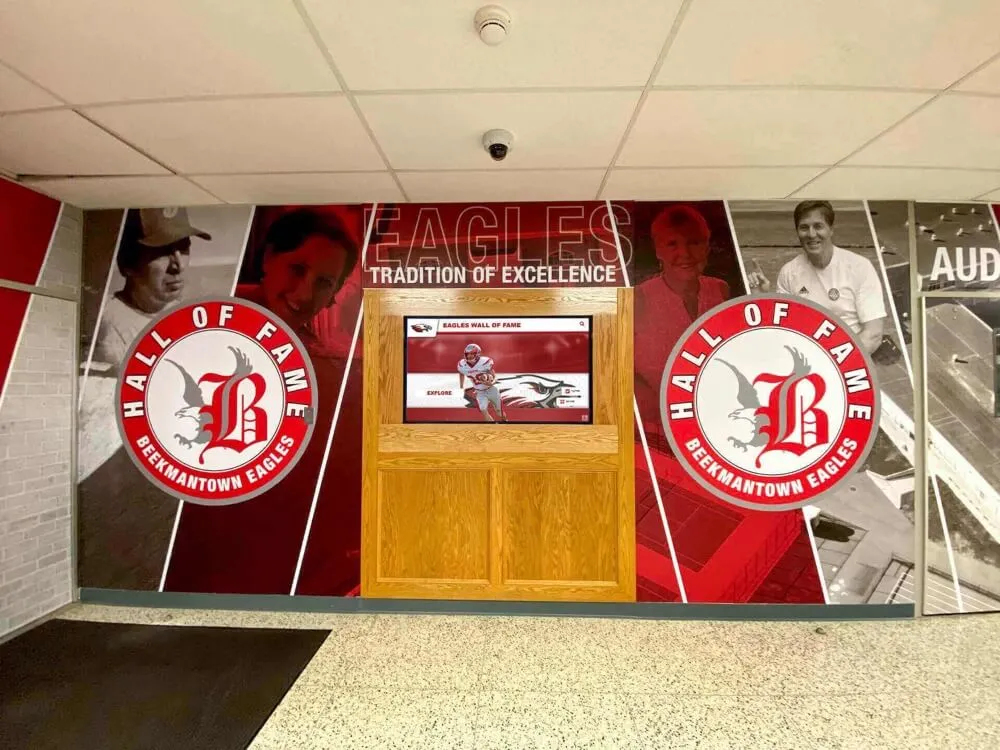
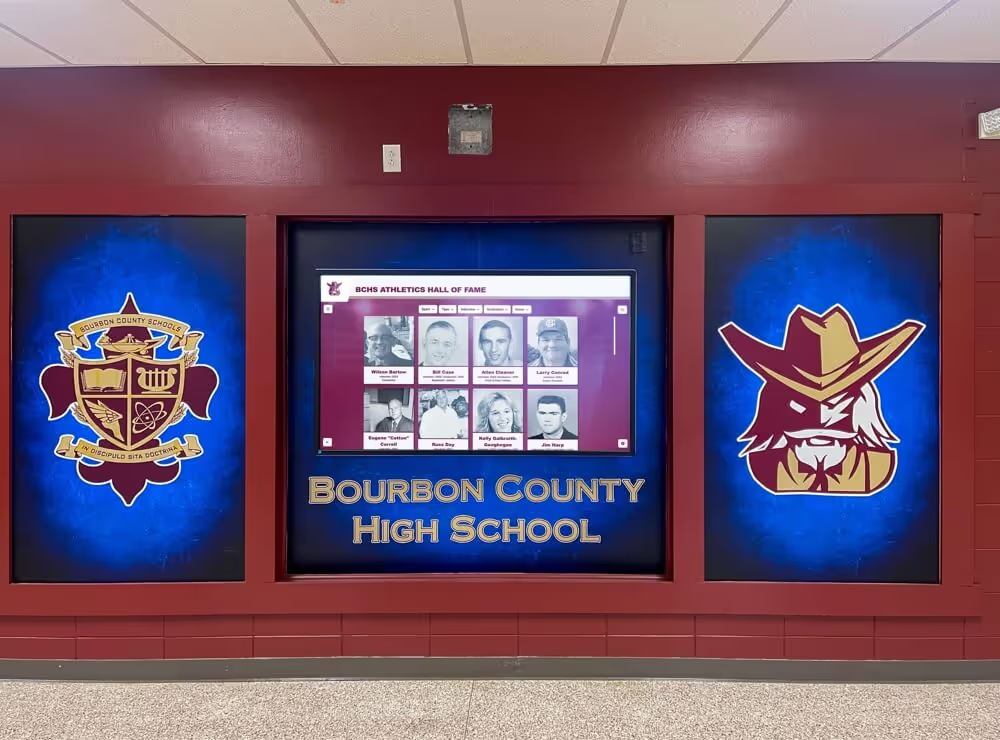
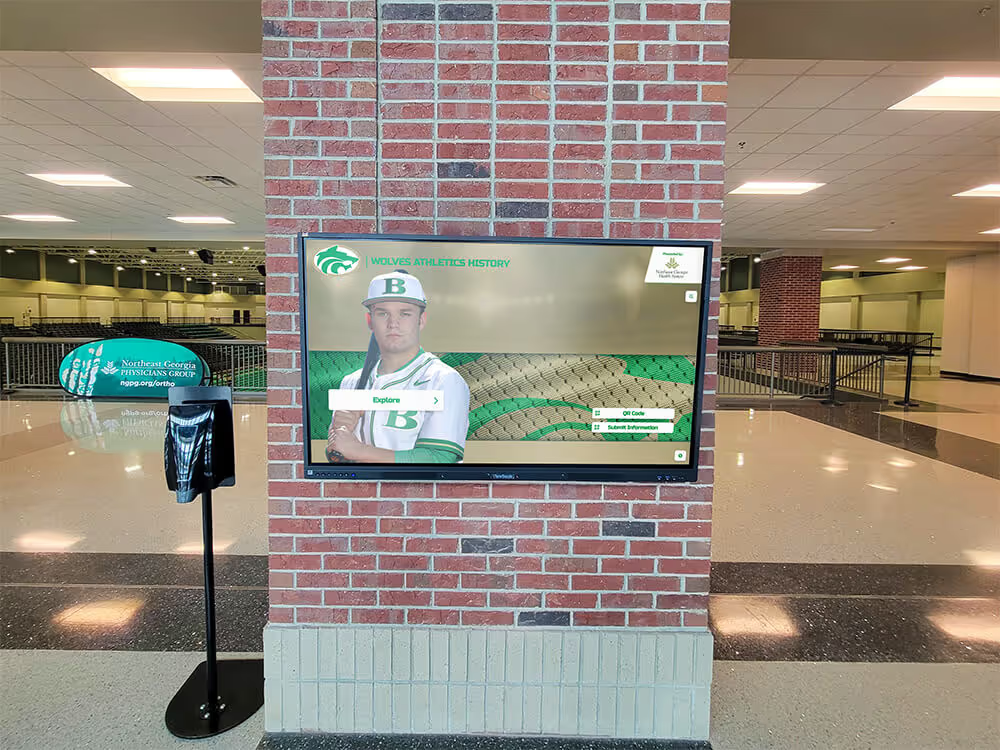
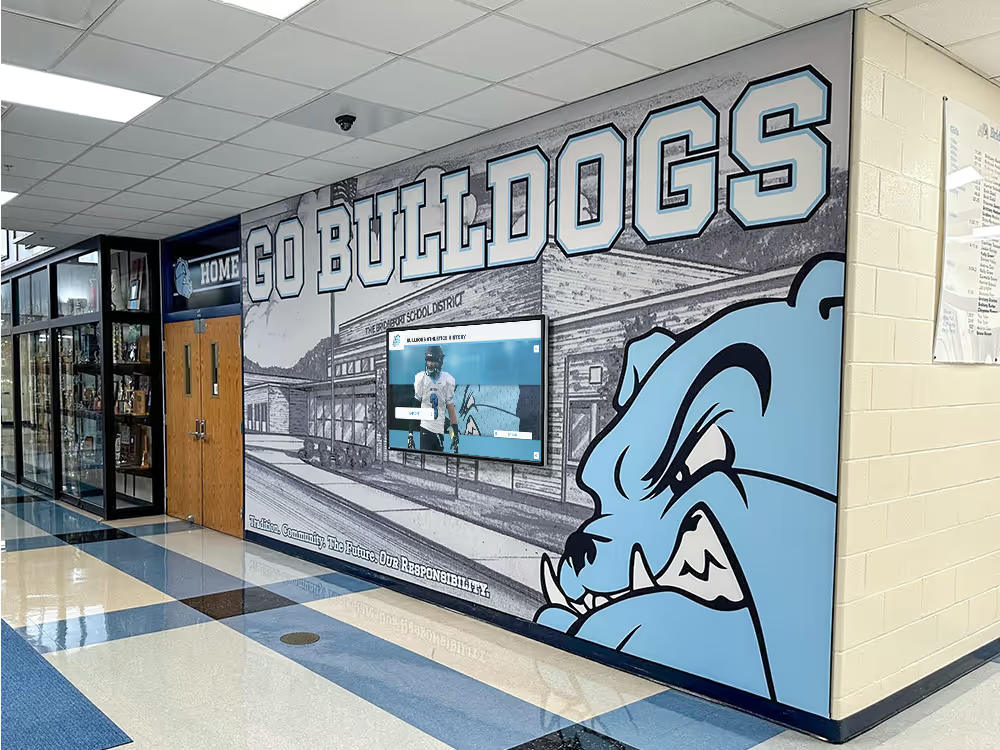
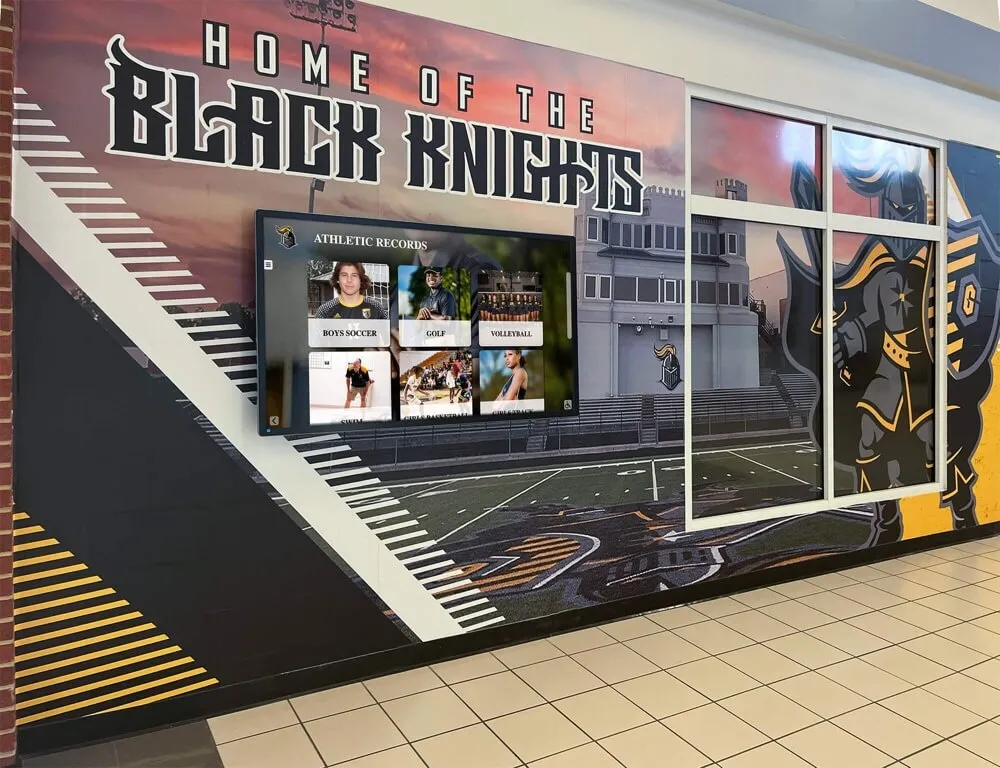
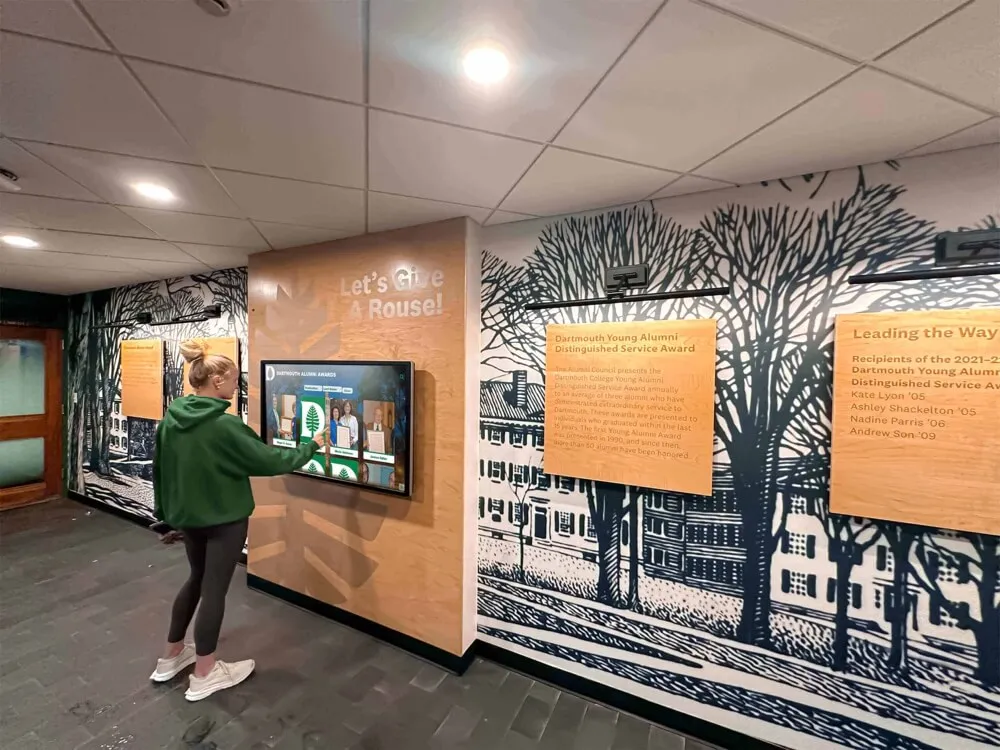
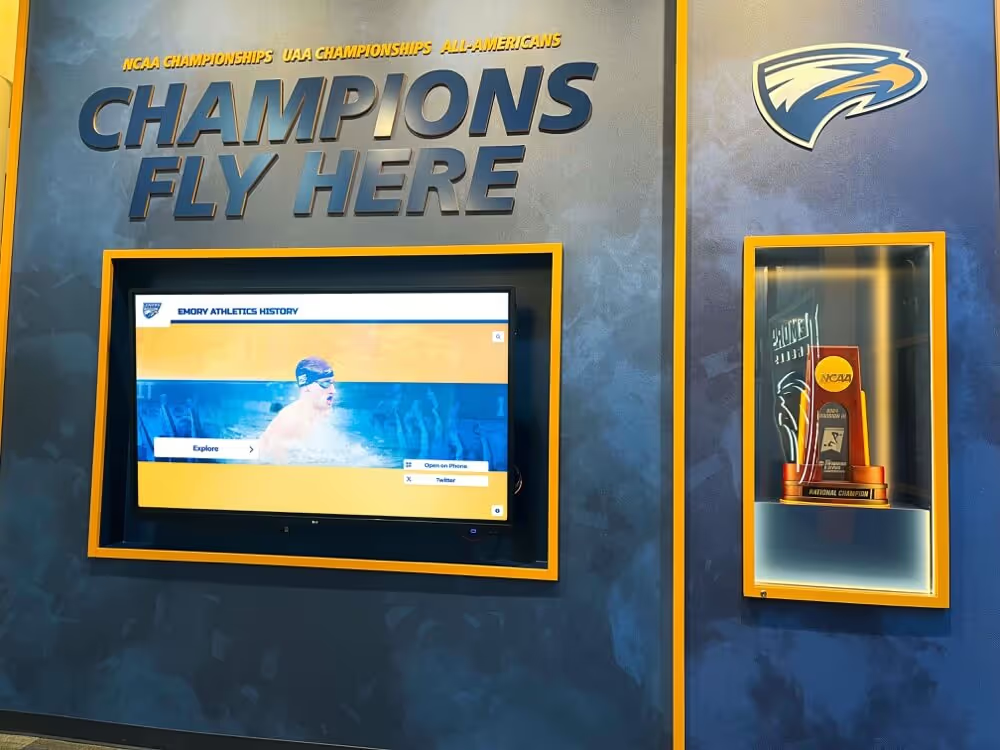
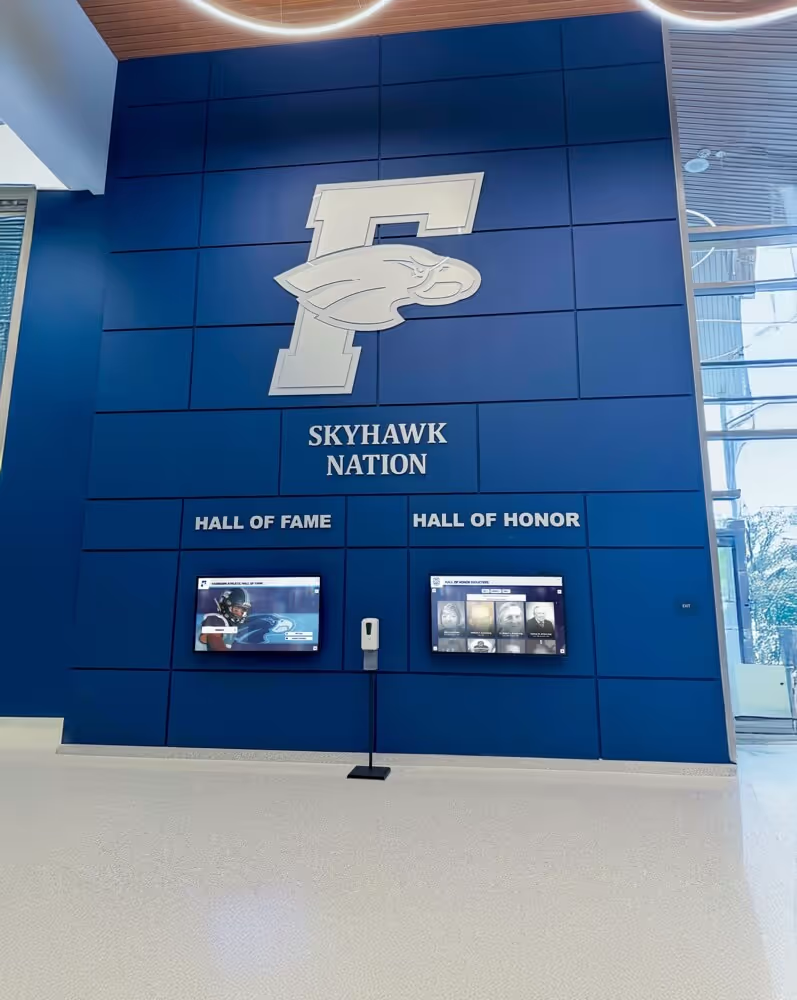
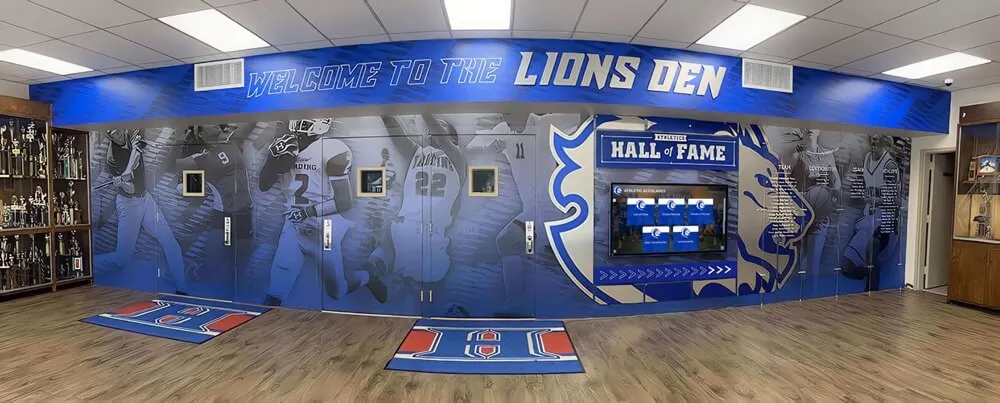
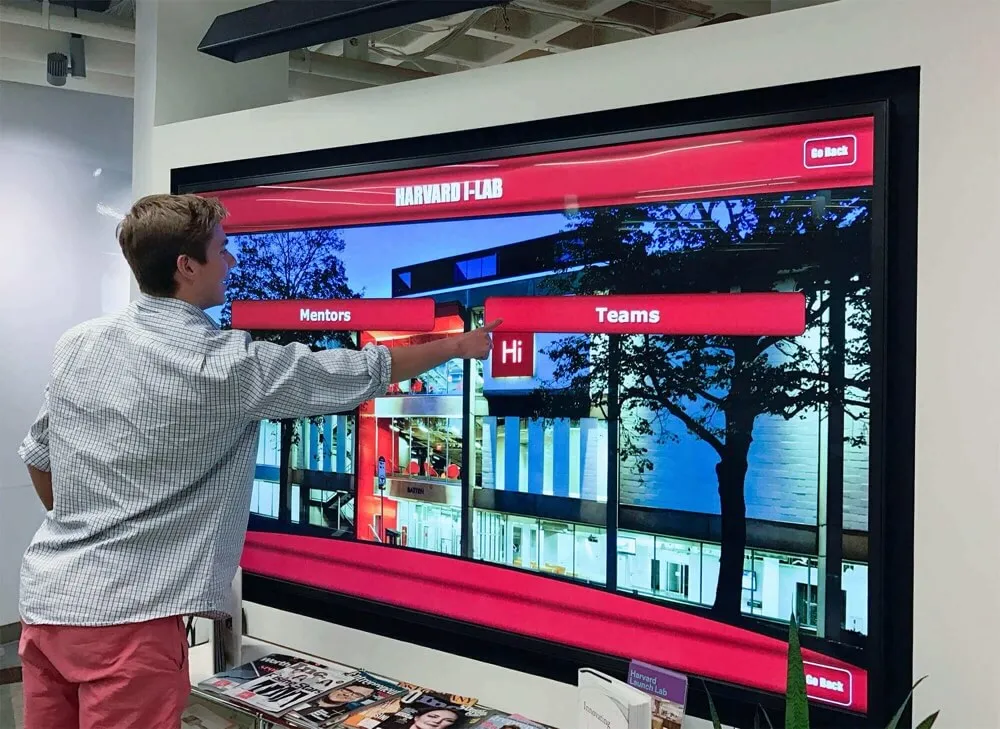
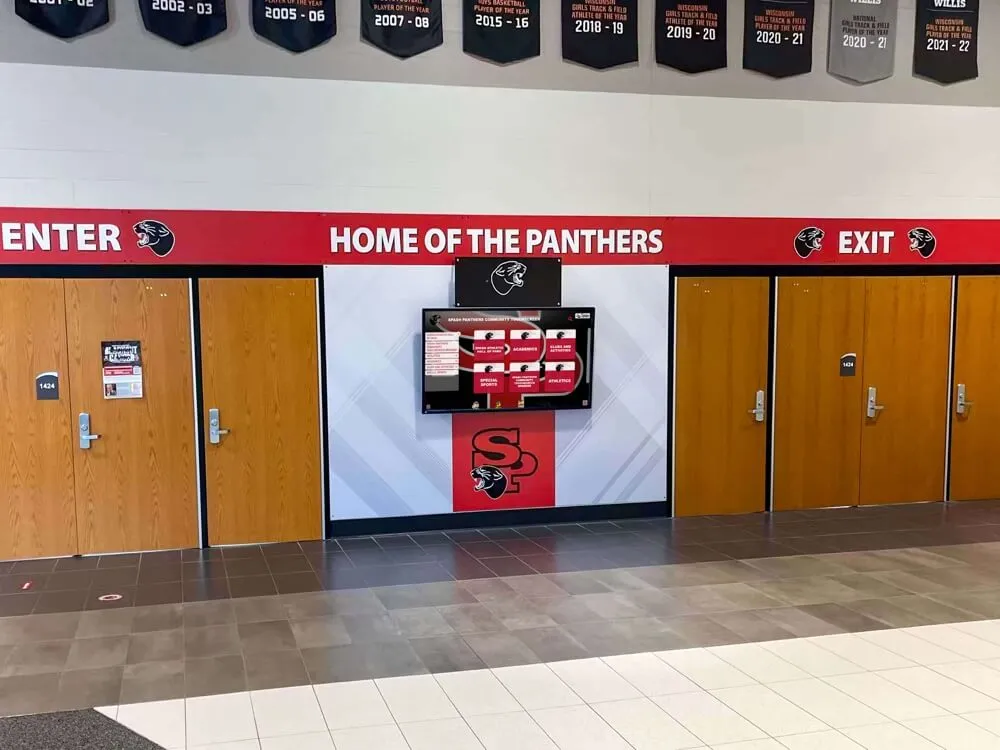
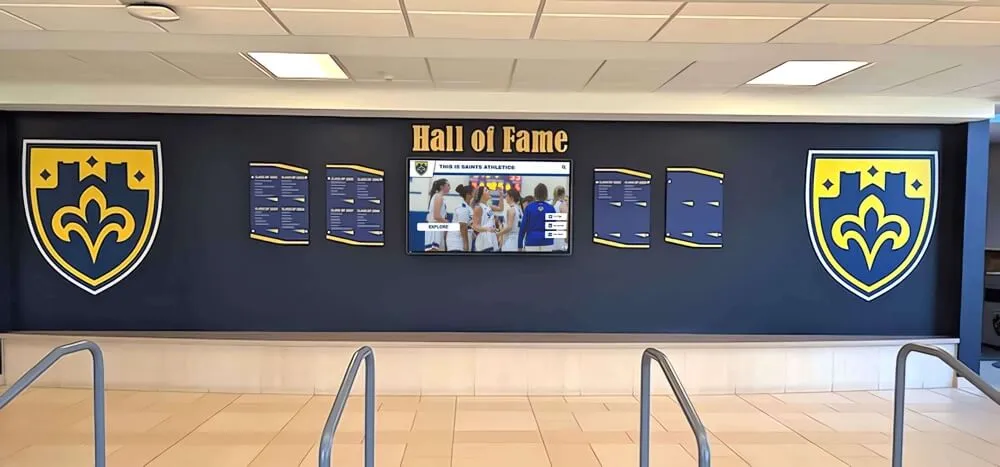
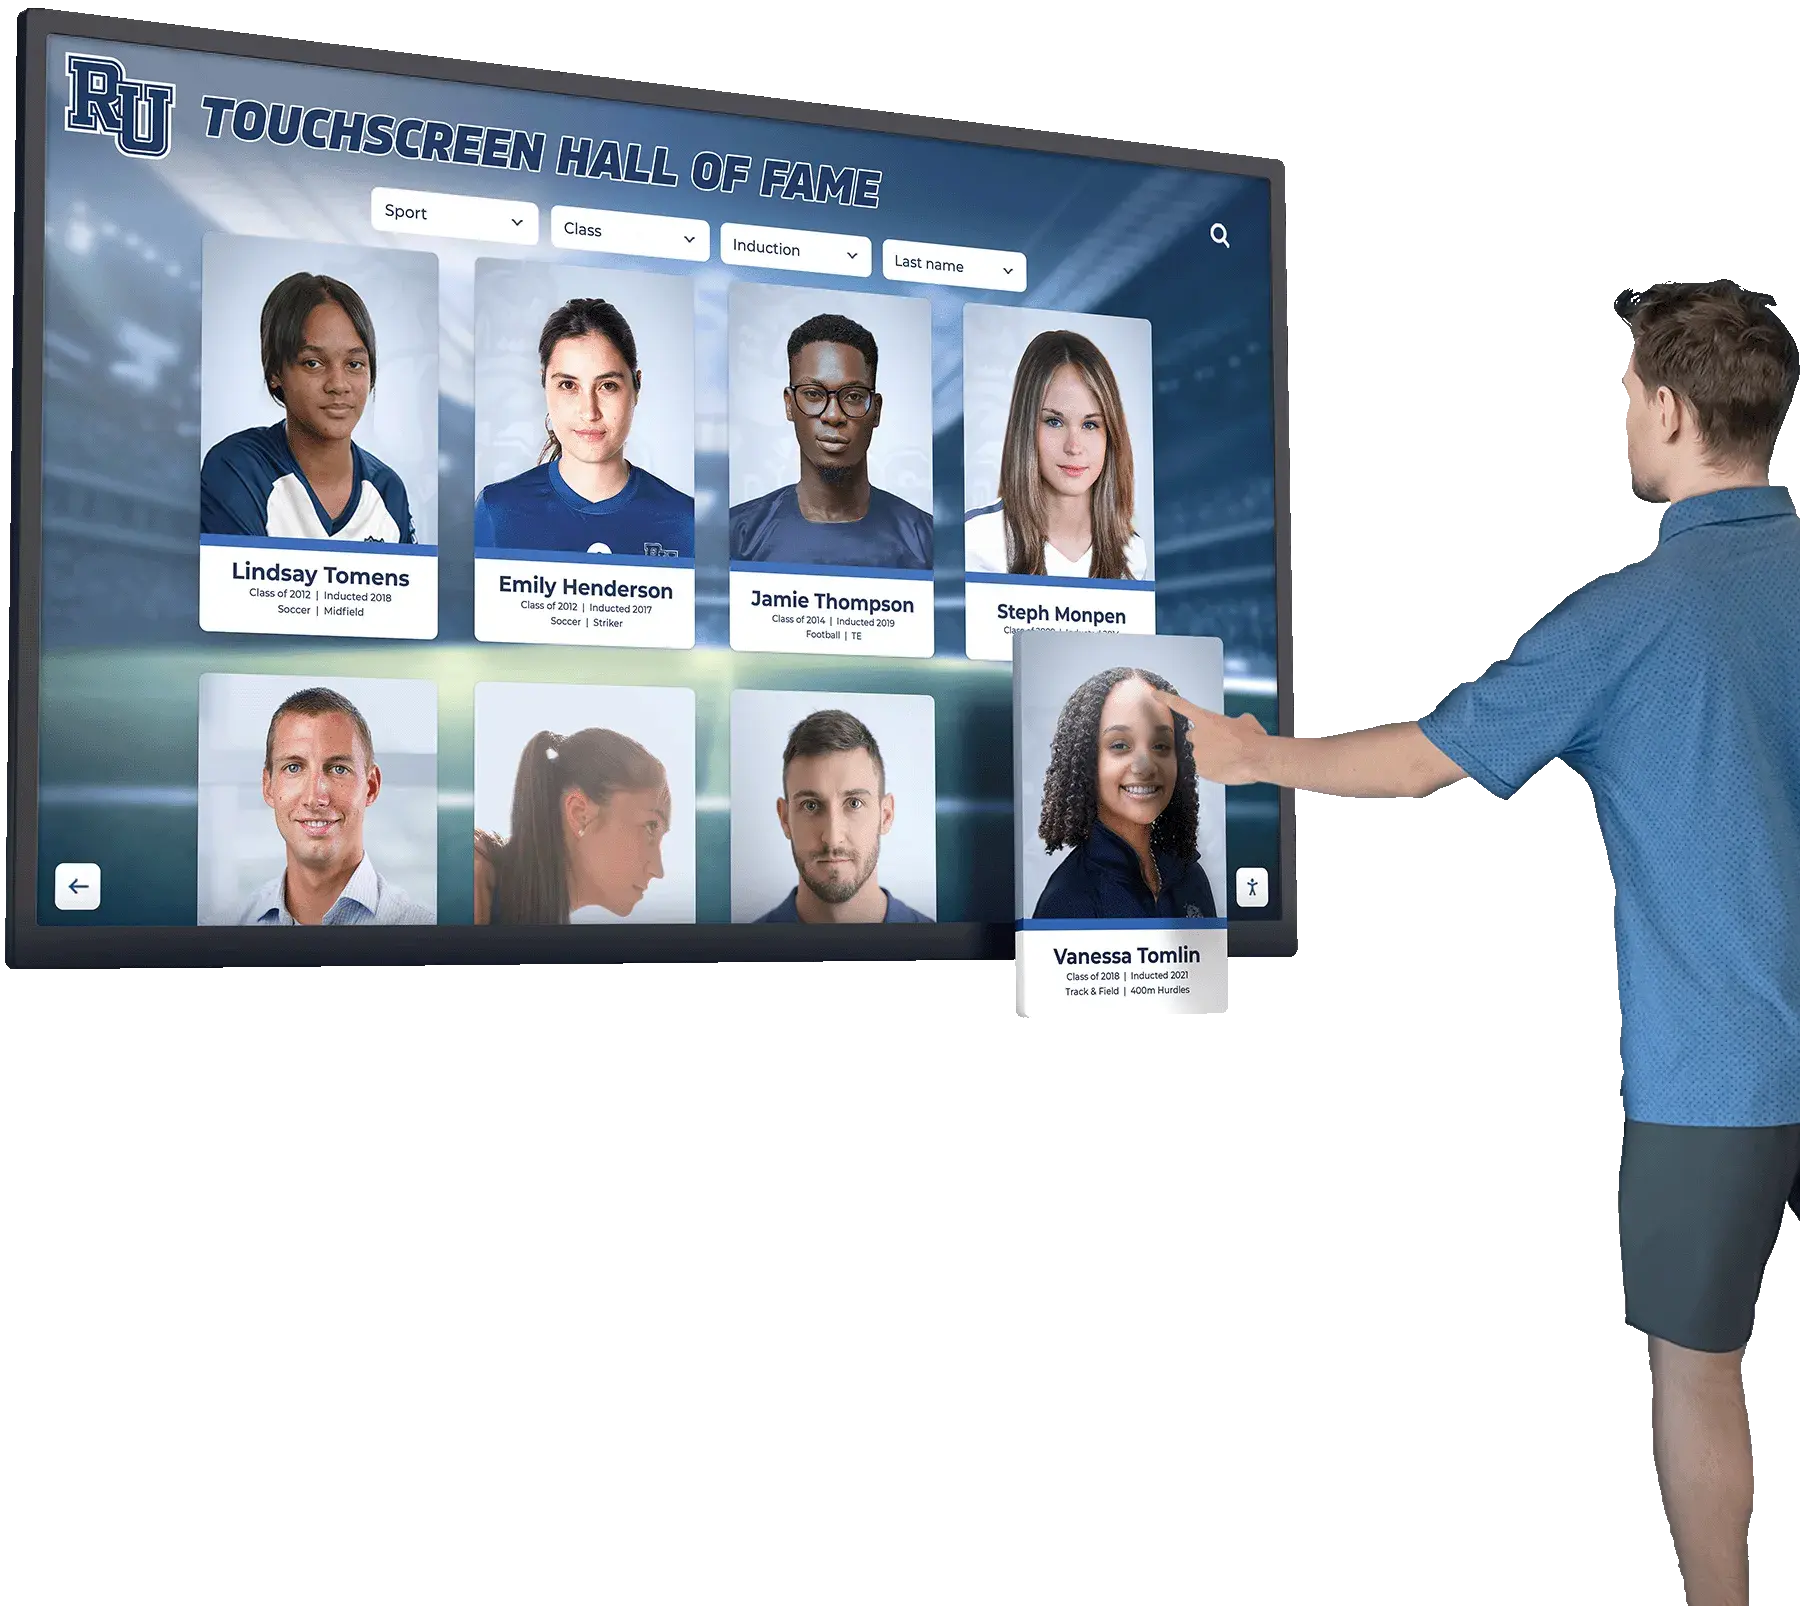
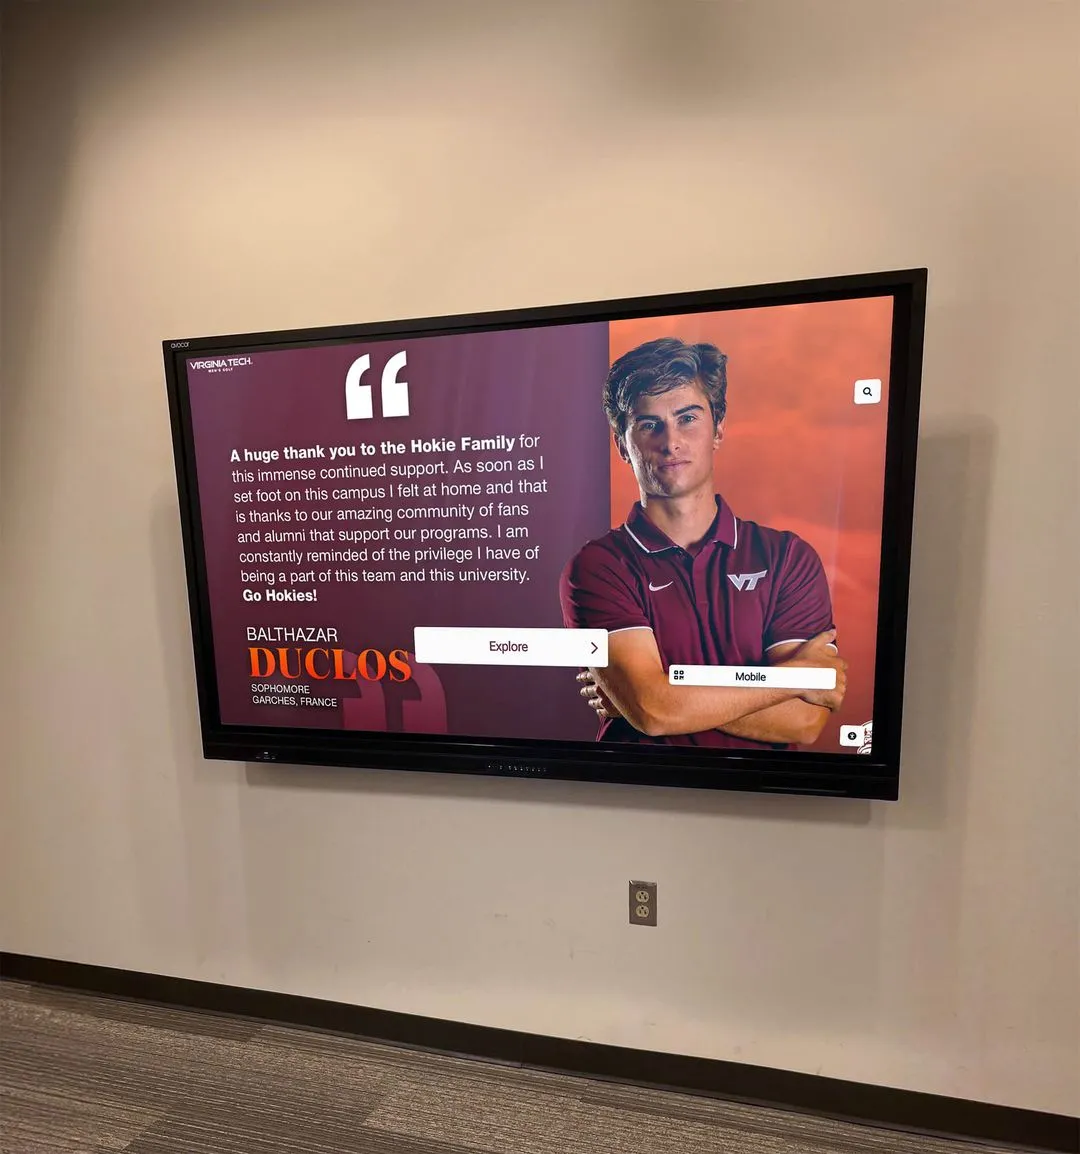
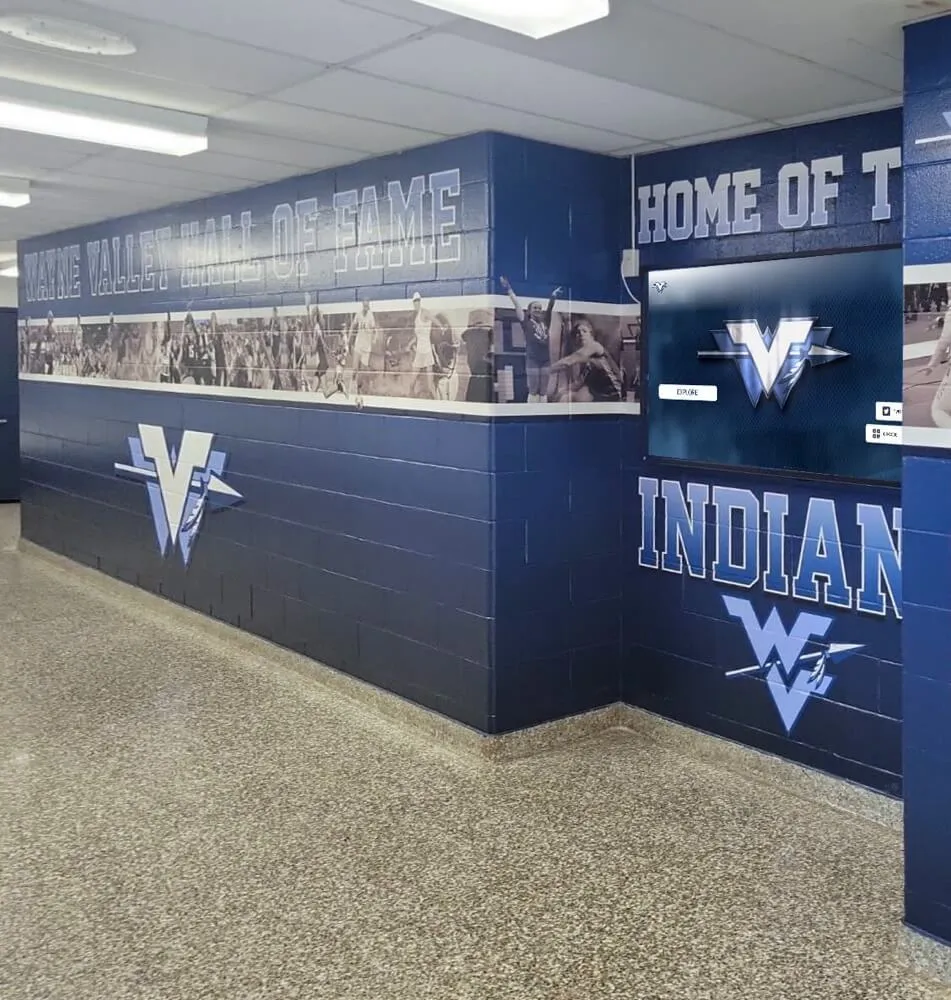
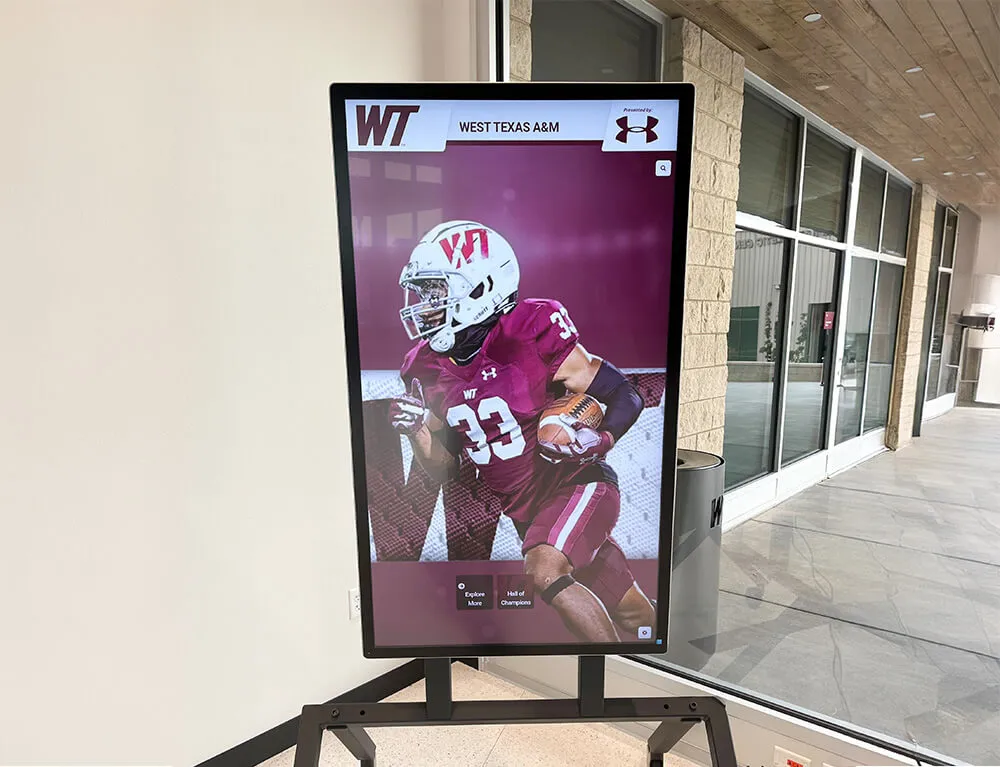
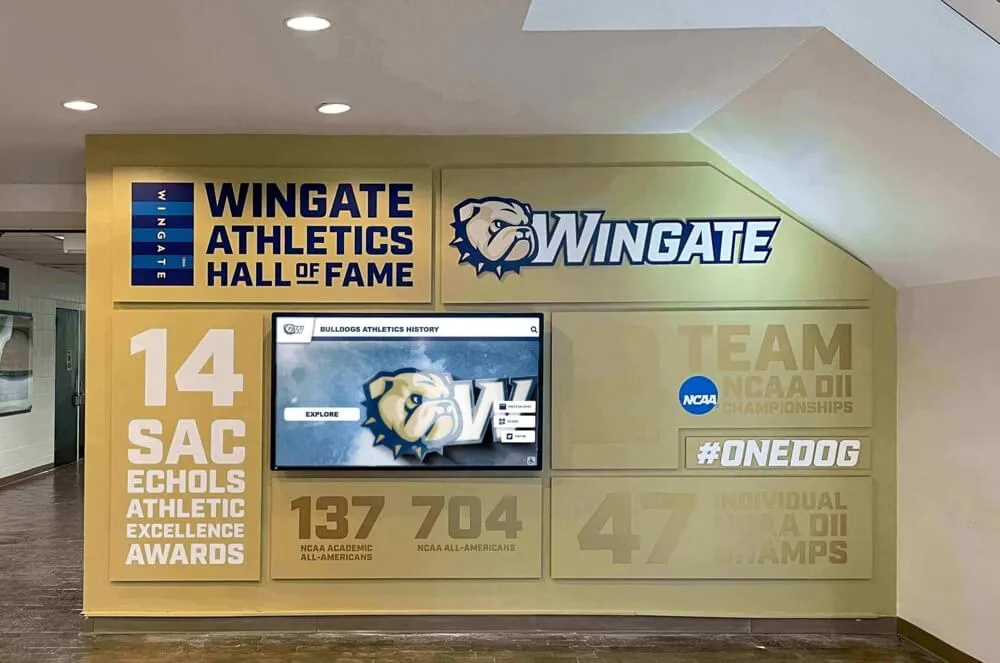
Athletic directors and facilities managers face a common challenge: static record boards that display unchanging lists of names and times fail to capture attention or generate the excitement athletic achievements deserve. Students walk past trophy cases without stopping. Alumni visiting campus can’t find their achievements among decades of records. Coaches struggle to update displays when athletes break records mid-season.
Digital record boards solve these engagement problems by transforming static lists into interactive experiences that students, athletes, and visitors actually explore. This guide provides 20 specific ways to configure your digital record board to maximize campus engagement, from real-time statistics during competitions to searchable archives that connect current athletes with historical achievements.
Before You Start: Configuration Requirements
Document these baseline requirements before implementing engagement features:
- Content volume: Number of sports, total records tracked, years of historical data
- Update frequency: Daily stats during season, weekly highlights, real-time game integration
- User access: Athletic staff, coaches, IT administrators, student media teams
- Network connectivity: Bandwidth for video content, WiFi reliability, content delivery method
- Display locations: Gymnasium lobbies, athletic facilities, student centers, outdoor stadiums
Understanding your starting point determines which engagement ideas deliver the most value for your specific campus.
20 Engagement Ideas for Digital Record Boards
1. Real-Time Season Statistics Dashboard
Display current season statistics that update automatically after each competition. Configure your board to show:
- Current leaders in each statistical category
- Season progression charts comparing to historical records
- Records within reach with gaps highlighted
- Countdown metrics showing attempts needed to break records
Update frequency: Daily during competition season, weekly during off-season.
Athletes check displays daily to track progress. Parents photograph updated stats after competitions. Coaches reference displays when discussing performance goals with teams.
2. Pre-Game Opponent History
Schedule content to display automatically before home competitions showing historical records against that day’s opponent. Include:
- Head-to-head record summaries
- Notable past victories with photos and scores
- Records set during previous matchups
- Alumni who competed against the same opponent
This contextualizes today’s competition within your program’s history. Students arriving early for games learn rivalry context. Alumni attending games see connections between current and past competitions.
3. Record Progression Timelines
Visualize how specific records evolved over decades. Show:
- Initial record holder with year and performance
- Each subsequent improvement with athlete name and margin
- Photos of record holders across eras
- Current record with historical context
Interactive timelines let visitors explore by sport, by decade, or by record type. This transforms isolated numbers into stories of program development.
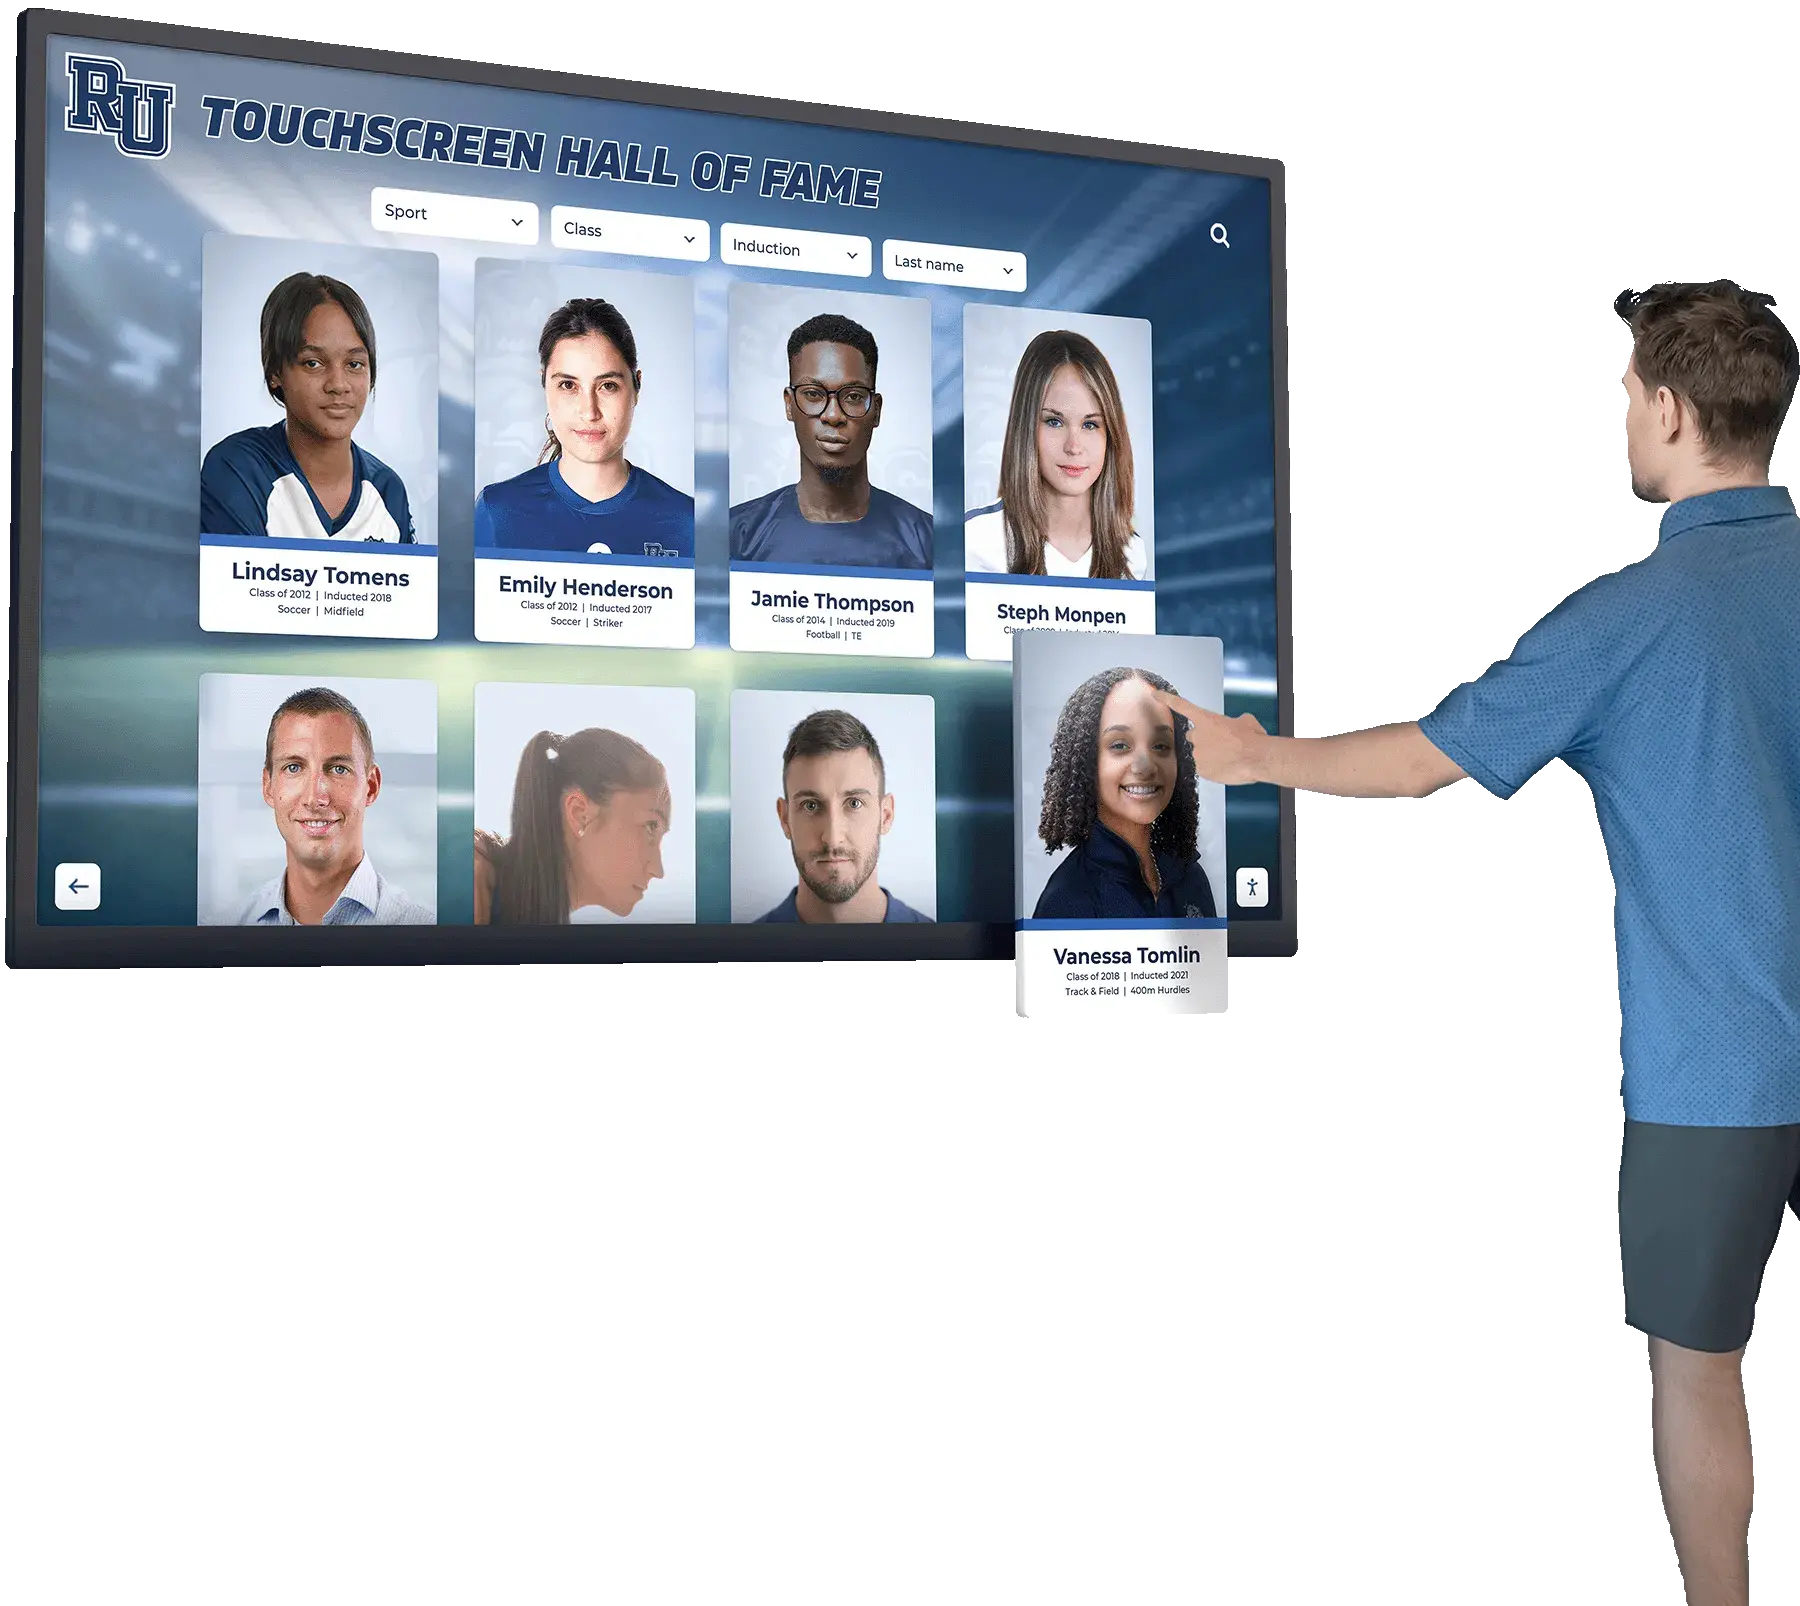

4. Searchable Athlete Database
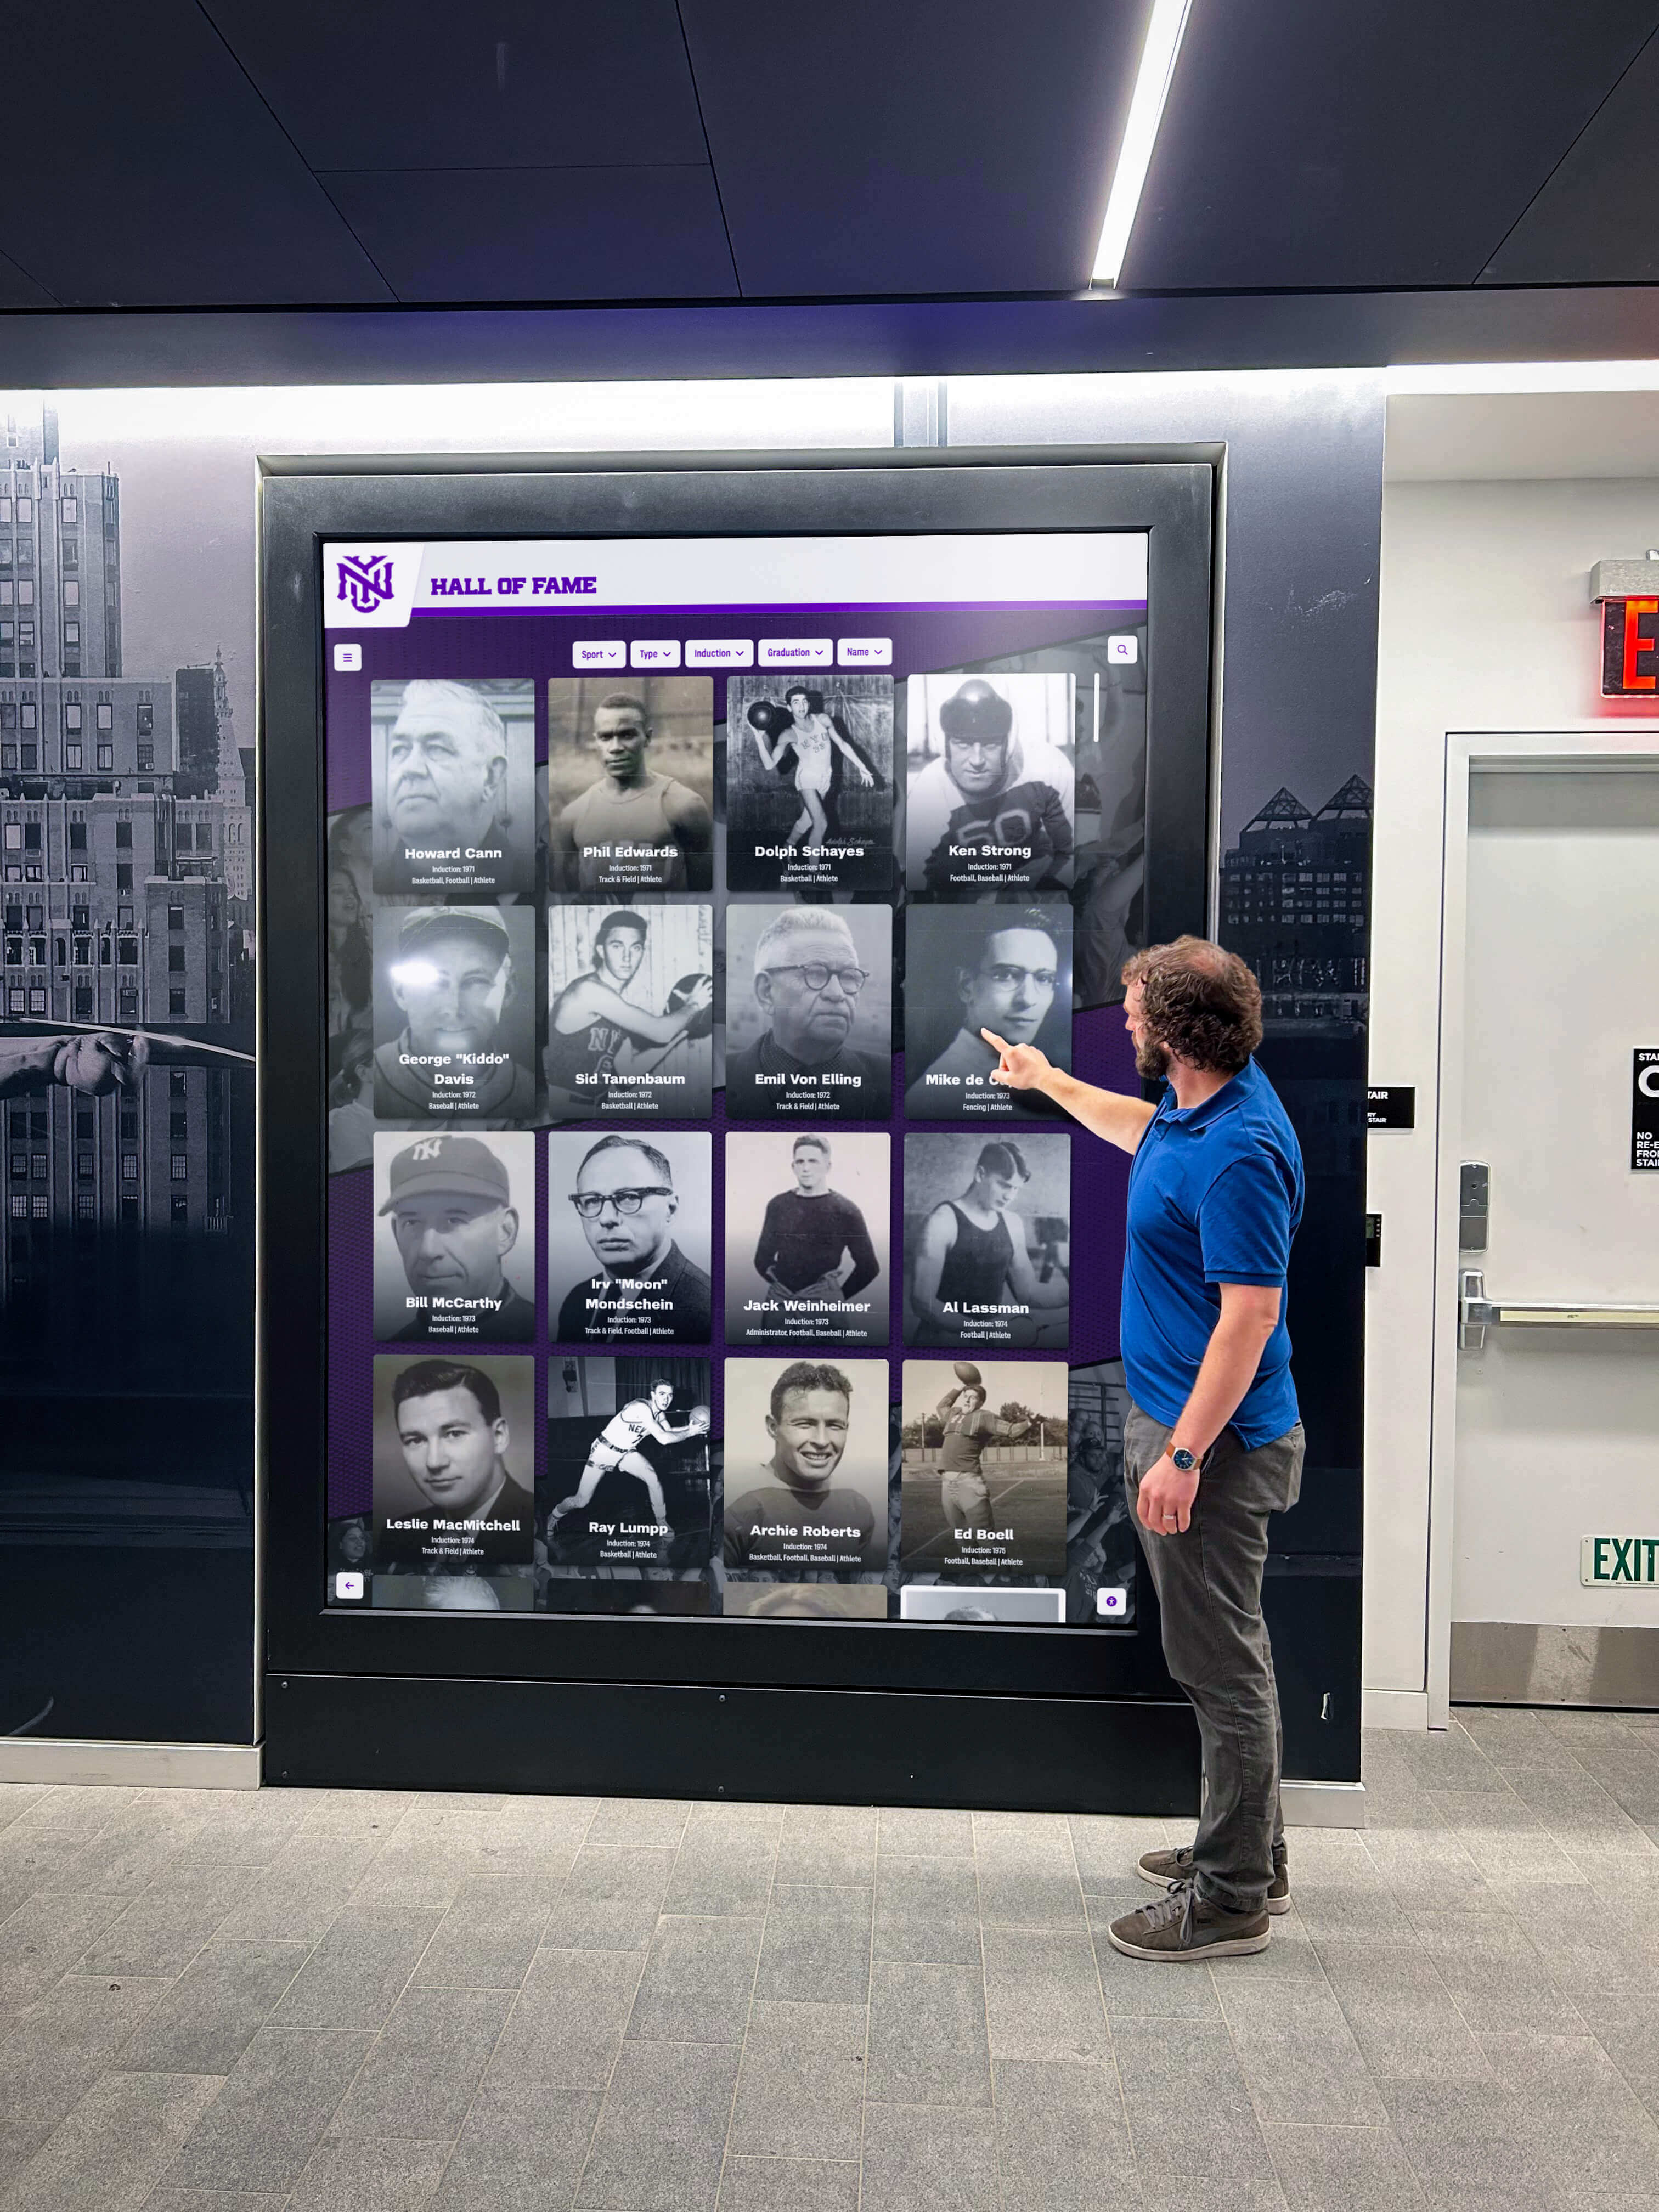
Enable visitors to search by athlete name, graduating year, sport, or achievement type. Essential search features include:
- Full name and nickname searching
- Filters for sport, position, years competed
- Sorting by statistical categories
- Related athlete suggestions based on team or era
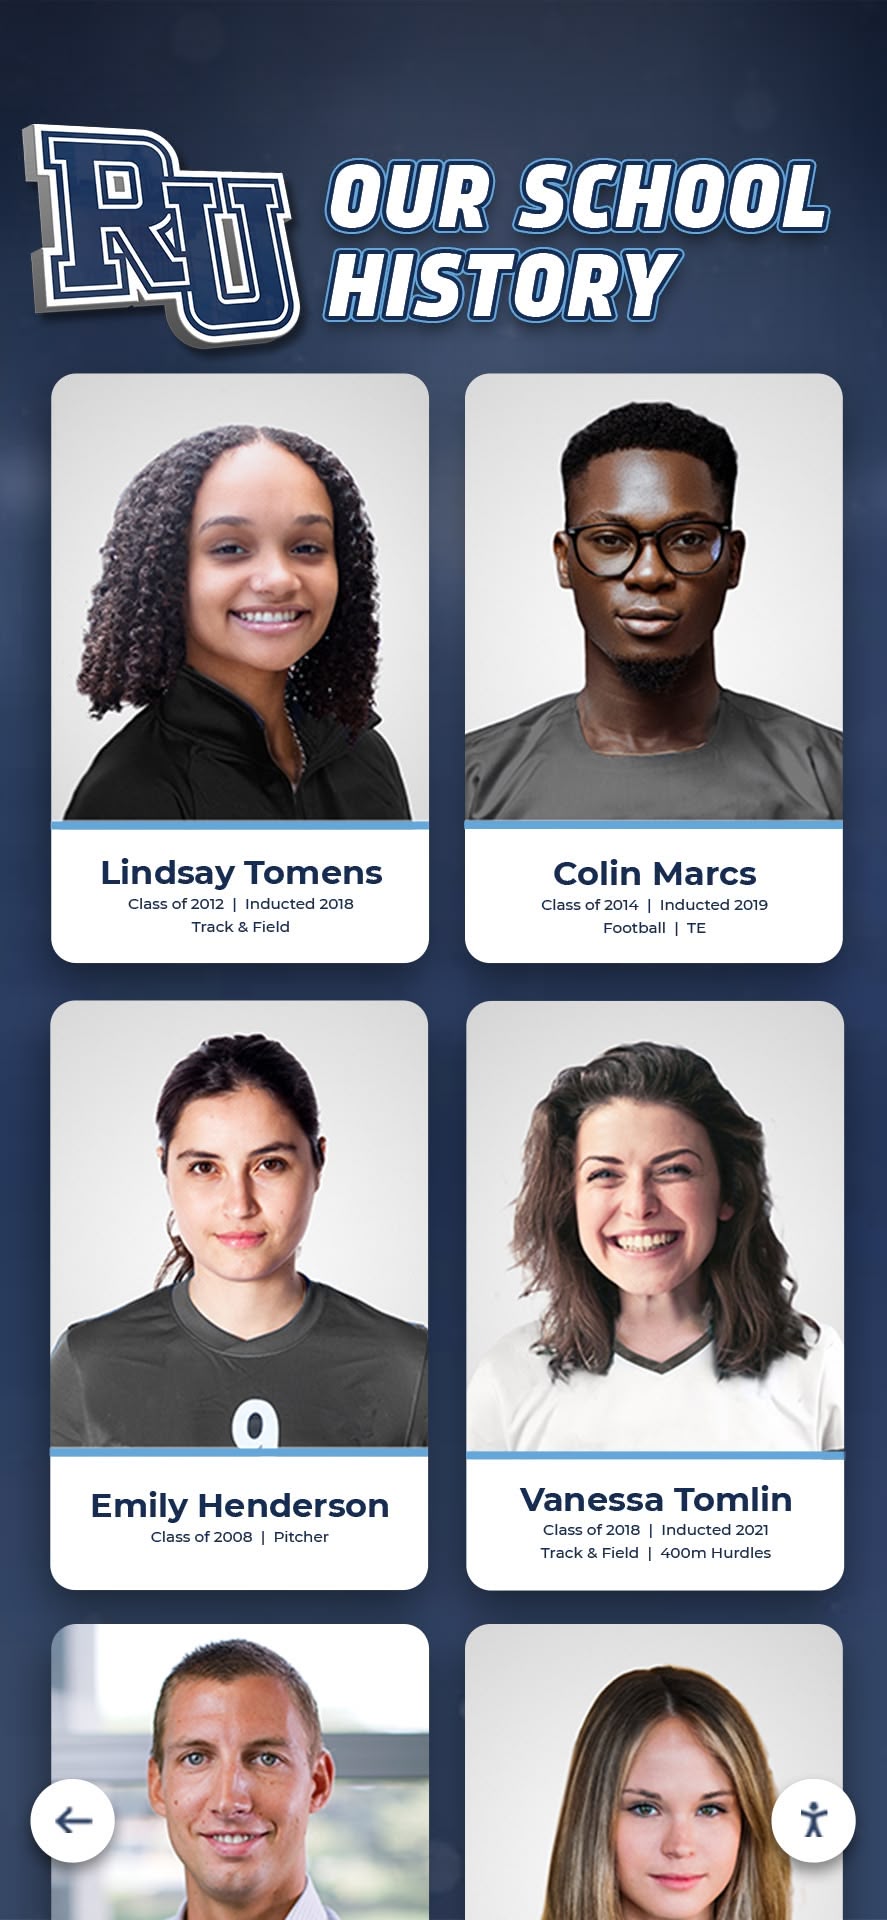
Alumni visiting campus can find their own records instantly. Current athletes explore teammates’ achievements. Families search for siblings or relatives who competed previously.
5. Senior Night Tribute Displays
Schedule automatic content changes on senior recognition nights. Display:
- Senior athlete profiles with career statistics
- Photo galleries from four years of competition
- Individual achievement highlights
- Team contributions beyond statistics
Program the display to activate when families arrive before ceremonies. Parents photograph their athlete’s profile. Underclassmen see what four-year commitment produces.
6. Historical Team Photo Archives
Digitize and display decades of team photos in browsable galleries. Organize by:
- Sport and season
- Championship teams highlighted
- Zoom functionality to read names and jersey numbers
- Links from team photos to individual athlete profiles
This preserves deteriorating physical photos while making them accessible. Alumni locate themselves in decades-old team pictures. Current athletes see uniforms and facilities from previous generations. Digitizing school history protects these materials from further deterioration.
7. Record-Breaking Alert System
Configure displays to automatically highlight recent record-breaking performances. Show:
- Athlete photo and new record
- Previous record holder and margin of improvement
- Video highlights if available
- Social media sharing QR codes
Keep alerts visible for one week, then archive to searchable database. This celebrates achievements immediately and encourages repeat visits to see new records.
8. Multi-Sport Comparative Views
Display records across multiple sports simultaneously to show breadth of athletic program. Create views showing:
- Current record holders from every sport on one screen
- Year-by-year program achievements across all teams
- Statistical leaders sorted by sport or achievement type
- Championship history from all sports combined
This benefits schools with diverse athletic programs where students may not follow every sport. It demonstrates overall program excellence rather than individual sport dominance.
9. Alumni Spotlight Rotation
Feature accomplished alumni monthly with connections to their athletic records. Display:
- Athletic achievements and records held
- College or professional sports career
- Current career and community involvement
- Photos from their competing years and present day
Rotate featured alumni monthly. Prioritize recent graduates early in year, shift to milestone reunion classes as alumni events approach. This shows current athletes tangible career paths.
10. State Championship Documentation
Create dedicated sections documenting each state championship with comprehensive details:
- Complete roster with individual statistics
- Season record and playoff bracket progression
- Game-by-game results with scores
- Photos from championship game and celebration
- Newspaper clippings and media coverage
This transforms single trophy cases into explorable championships. Visitors spend 5-10 minutes exploring details rather than glancing at a plaque.
11. Record Categories by Decade
Organize records chronologically to show program evolution. Compare:
- School records from each decade displayed side-by-side
- Performance improvements in specific events over time
- Equipment or rule changes that affected records
- Era-specific achievements that remain competitive
This contextualizes older records that may appear less impressive by current standards. It honors achievement within historical context rather than judging all performances by modern metrics.
12. Interactive Statistical Leaderboards
Display top-10 performers in dozens of statistical categories with filtering options:
- Career statistics vs. single-season records
- Individual performance vs. team records
- Sort by any statistical category
- Filter by gender, sport, or decade
Deep statistical tracking engages athletes who study performance metrics. It recognizes excellence beyond championship teams—individual excellence on any team earns recognition.
13. Homecoming Week Historical Features
Schedule automatic content highlighting milestone reunion classes during homecoming week. Display:
- Class year with championship highlights from their era
- Notable alumni from that graduating class
- Photos from their competition years
- Invitation to update profiles with current information
This encourages alumni engagement during peak campus visits. It personalizes displays for visitors who competed in featured eras.
14. Coach Legacy Documentation
Dedicate sections to longtime coaches documenting their program impact. Include:
- Overall record and winning percentage
- Championships and playoff appearances
- Individual athletes coached who hold records
- Philosophy quotes and memorable season highlights
- Career timeline with photos spanning decades
This honors coaching contributions beyond win-loss records. It preserves institutional knowledge as coaching tenures end. These profiles can become part of your broader athletic hall of fame recognition program.
15. QR Code Archive Access
Display QR codes that link to complete digital archives accessible on personal devices. Provide:
- Individual athlete profile pages
- Full statistical databases downloadable as spreadsheets
- Photo galleries with download capability
- Video highlight collections if available
Visitors scan codes to continue exploring on phones during commutes home. Alumni share their individual profile links via email signatures or social media. This extends engagement beyond the physical display location.
16. Conference Record Comparisons
Display your records alongside conference or regional records to provide competitive context. Show:
- School records with conference records listed adjacent
- State records in relevant categories
- National high school or college records for perspective
- Athletes who hold both school and higher-level records
This demonstrates where your program excels regionally or nationally. It sets concrete goals—breaking school records is excellent, but matching conference records defines elite performance.
17. Motivational Training Metrics
Display specific training achievements that led to record performances:
- Strength training numbers for record-breaking athletes
- Practice times or repetitions during preparation
- Seasonal progression showing consistent improvement
- Training philosophies or routines described
This shifts focus from genetic talent to work ethic. Current athletes see specific training paths that produced record performances, making elite achievement feel attainable through dedicated preparation.
18. Game Day Countdown Features
Configure displays to automatically show countdowns before major competitions:
- Days until rivalry games or playoffs
- Historical performance against upcoming opponents
- Records set during previous games against opponent
- Fan engagement prompts encouraging attendance
Update automatically based on schedule imports. This builds anticipation for competitions and connects upcoming games to program history.
19. Team Record vs. Individual Record Split Views
Separate team achievements from individual records for clarity:
- Team records: Championships, winning streaks, team scoring
- Individual records: Personal bests, career statistics, single-game performances
- Split-screen views showing both simultaneously
- Filter toggles to focus on either category
This prevents confusion when visitors search for specific record types. It honors both individual excellence and team success without mixing categories.
20. User-Submitted Content Integration
Enable controlled submission of photos, videos, or stories from alumni and community members:
- Approval workflow before content publishes
- Submit via QR code scan or web form
- Categories for photos, video highlights, written memories
- Credit submitters with name and graduating year
This crowdsources historical content you may not possess. Alumni contribute photos from their competition eras. Parents share video highlights from recent competitions. The display becomes a living archive built by your community.
Implementation Checklist: Activating Engagement Features
Use this checklist to implement engagement features systematically:
| Implementation Phase | Tasks | Timeline | Responsible Party |
|---|---|---|---|
| Content Audit | Inventory existing records, identify gaps, document sources | Week 1-2 | Athletic Director |
| Digitization | Photograph trophies/plaques, scan yearbooks, compile statistics | Week 3-6 | Student workers or vendor |
| Database Structure | Define fields, categorize records, establish relationships | Week 4-5 | IT Administrator |
| Design Configuration | Customize layouts, select navigation structure, brand integration | Week 6-7 | Design team or vendor |
| Content Migration | Upload records, verify accuracy, link related content | Week 7-9 | Athletic staff |
| Feature Activation | Enable search, schedule automatic content, configure interactive elements | Week 9-10 | IT Administrator |
| Testing | Verify all features, check mobile/web access, test QR codes | Week 10-11 | Cross-functional team |
| Training | Train staff on updates, document procedures, plan ongoing maintenance | Week 11-12 | Vendor or IT staff |
| Launch Event | Announce display, demonstrate features, encourage first interactions | Week 12 | Athletic Director |
Adjust timelines based on content volume and available resources. Schools with extensive historical archives require longer digitization periods. Recent programs with limited history can accelerate through early phases.
Measuring Engagement Success
Track these metrics to evaluate which features generate the most engagement:
Physical Display Metrics
- Session duration: Time visitors spend interacting (target: 3-5 minutes average)
- Daily interactions: Number of touch sessions per day
- Feature usage: Which search filters, categories, or content types get accessed most
- Peak usage times: When displays see highest traffic (schedule fresh content accordingly)
- Return visits: Devices that interact multiple times (tracked via device fingerprinting)
Web Access Metrics
- QR code scans: How many visitors transition from physical to mobile viewing
- Direct URL visits: Traffic to individual athlete or record pages
- Social sharing: How often profiles get shared via social platforms
- Geographic distribution: Where web visitors access content from (measures alumni reach)
- Content downloads: How many visitors export photos or statistics
Compare metrics quarterly to identify trends. Increasing session duration indicates engaging content. Growing web traffic demonstrates effective QR code placement. Geographic spread of web visitors shows whether you’re reaching distant alumni populations.
Common Configuration Mistakes to Avoid
Overwhelming Navigation Complexity
Simple navigation keeps visitors engaged. Avoid:
- More than three levels of menu hierarchy
- Technical jargon in category names
- Inconsistent organization across sports
- Hidden features without clear access paths
Test navigation with students and parents. If they can’t find specific records within 30 seconds, simplify structure.
Neglecting Mobile Optimization
Many visitors explore content on personal devices after scanning QR codes. Ensure:
- Layouts adapt to phone screen sizes
- Text remains readable without zooming
- Touch targets stay large enough for thumb navigation
- Load times remain under 3 seconds on cellular connections
Test extensively on phones. Desktop-optimized layouts fail on mobile screens.
Forgetting Accessibility Requirements
Digital recognition displays must serve all visitors. Verify:
- Screen reader compatibility for visually impaired visitors
- High contrast modes for low vision
- Touch targets meet size requirements for limited dexterity
- Display mounting height follows ADA guidelines (controls 15-48 inches from floor)
Accessibility benefits everyone. Large touch targets prevent accidental selections. High contrast improves readability in bright lighting.
Static Content That Never Changes
Digital displays with static content fail as badly as physical plaques. Schedule:
- Weekly content updates during competition seasons
- Monthly feature rotations during off-seasons
- Automatic event-triggered content (homecoming, senior night, championship celebrations)
- Seasonal themes that refresh displays
Visitors stop returning if content never changes. Fresh content encourages repeat engagement.
Integration with Broader Campus Systems
Connect your digital record board with existing campus technology for automated updates and broader reach:
Athletic Management Software Integration
Import statistics automatically from:
- Game management systems that track scoring, times, statistics
- Scheduling software that provides opponent information and dates
- Registration systems with current rosters and athlete details
Automatic imports eliminate manual data entry. Records update overnight after competitions.
Student Information Systems
Link athlete profiles to:
- Academic achievement recognition (honor roll, academic all-conference)
- Graduation years and current enrollment status
- Contact information for alumni updates (with privacy controls)
This enables broader recognition beyond athletics. It connects athletic and academic excellence.
Social Media Platforms
Configure automatic posts when records break or content updates:
- New record achievements auto-post to school athletics accounts
- Featured alumni spotlights share to alumni network pages
- Championship documentation posts to team-specific accounts
Social integration extends engagement beyond campus. Parents share posts celebrating their athletes. Alumni engage with digital content from anywhere.
Digital Signage Networks
Display record board content on:
- Gymnasium scoreboards during competitions
- Cafeteria displays during lunch periods
- Hallway digital signs between class periods
- Outdoor marquees visible to passing traffic
Network integration puts content where students already look rather than requiring special trips to view displays.
Maintenance Requirements for Long-Term Engagement
Plan ongoing maintenance to keep engagement high:
Weekly Tasks
- Review recent competition results for record-breaking performances
- Update current season statistics
- Check physical display for damage or cleanliness
- Monitor analytics for unusual patterns (sudden drop in interactions may indicate technical issues)
Monthly Tasks
- Rotate featured alumni or historical highlights
- Add photos from recent competitions
- Verify links and QR codes still function
- Review most and least accessed content categories
Quarterly Tasks
- Analyze engagement metrics and adjust content strategy
- Refresh design elements to maintain visual interest
- Audit accuracy of historical records
- Test all interactive features
Annual Tasks
- Comprehensive content audit removing outdated information
- Major design refresh aligned with program branding updates
- Hardware maintenance inspection
- Strategic planning for new feature additions
Consistent maintenance prevents displays from becoming stale. Assign specific staff members to each task category rather than leaving maintenance unassigned where it often gets neglected.
Budget Considerations for Engagement Features
Different engagement features carry different cost implications:
Minimal Additional Cost:
- Real-time statistics (if athletic management software already tracks data)
- Searchable databases (included in most digital record board systems)
- QR code generation (free with web hosting)
- Scheduled content rotation (built into content management systems)
Moderate Additional Cost ($500-2,000):
- Professional video highlight compilation from existing footage
- Historical photo digitization services
- Custom design work for specialized views
- Social media integration development
Significant Additional Cost ($2,000-10,000+):
- Live game integration with real-time scoring
- Custom software development for unique features
- Extensive historical research and documentation
- Multiple display network installations
Prioritize high-engagement, low-cost features first. Measure their impact before investing in expensive custom development.
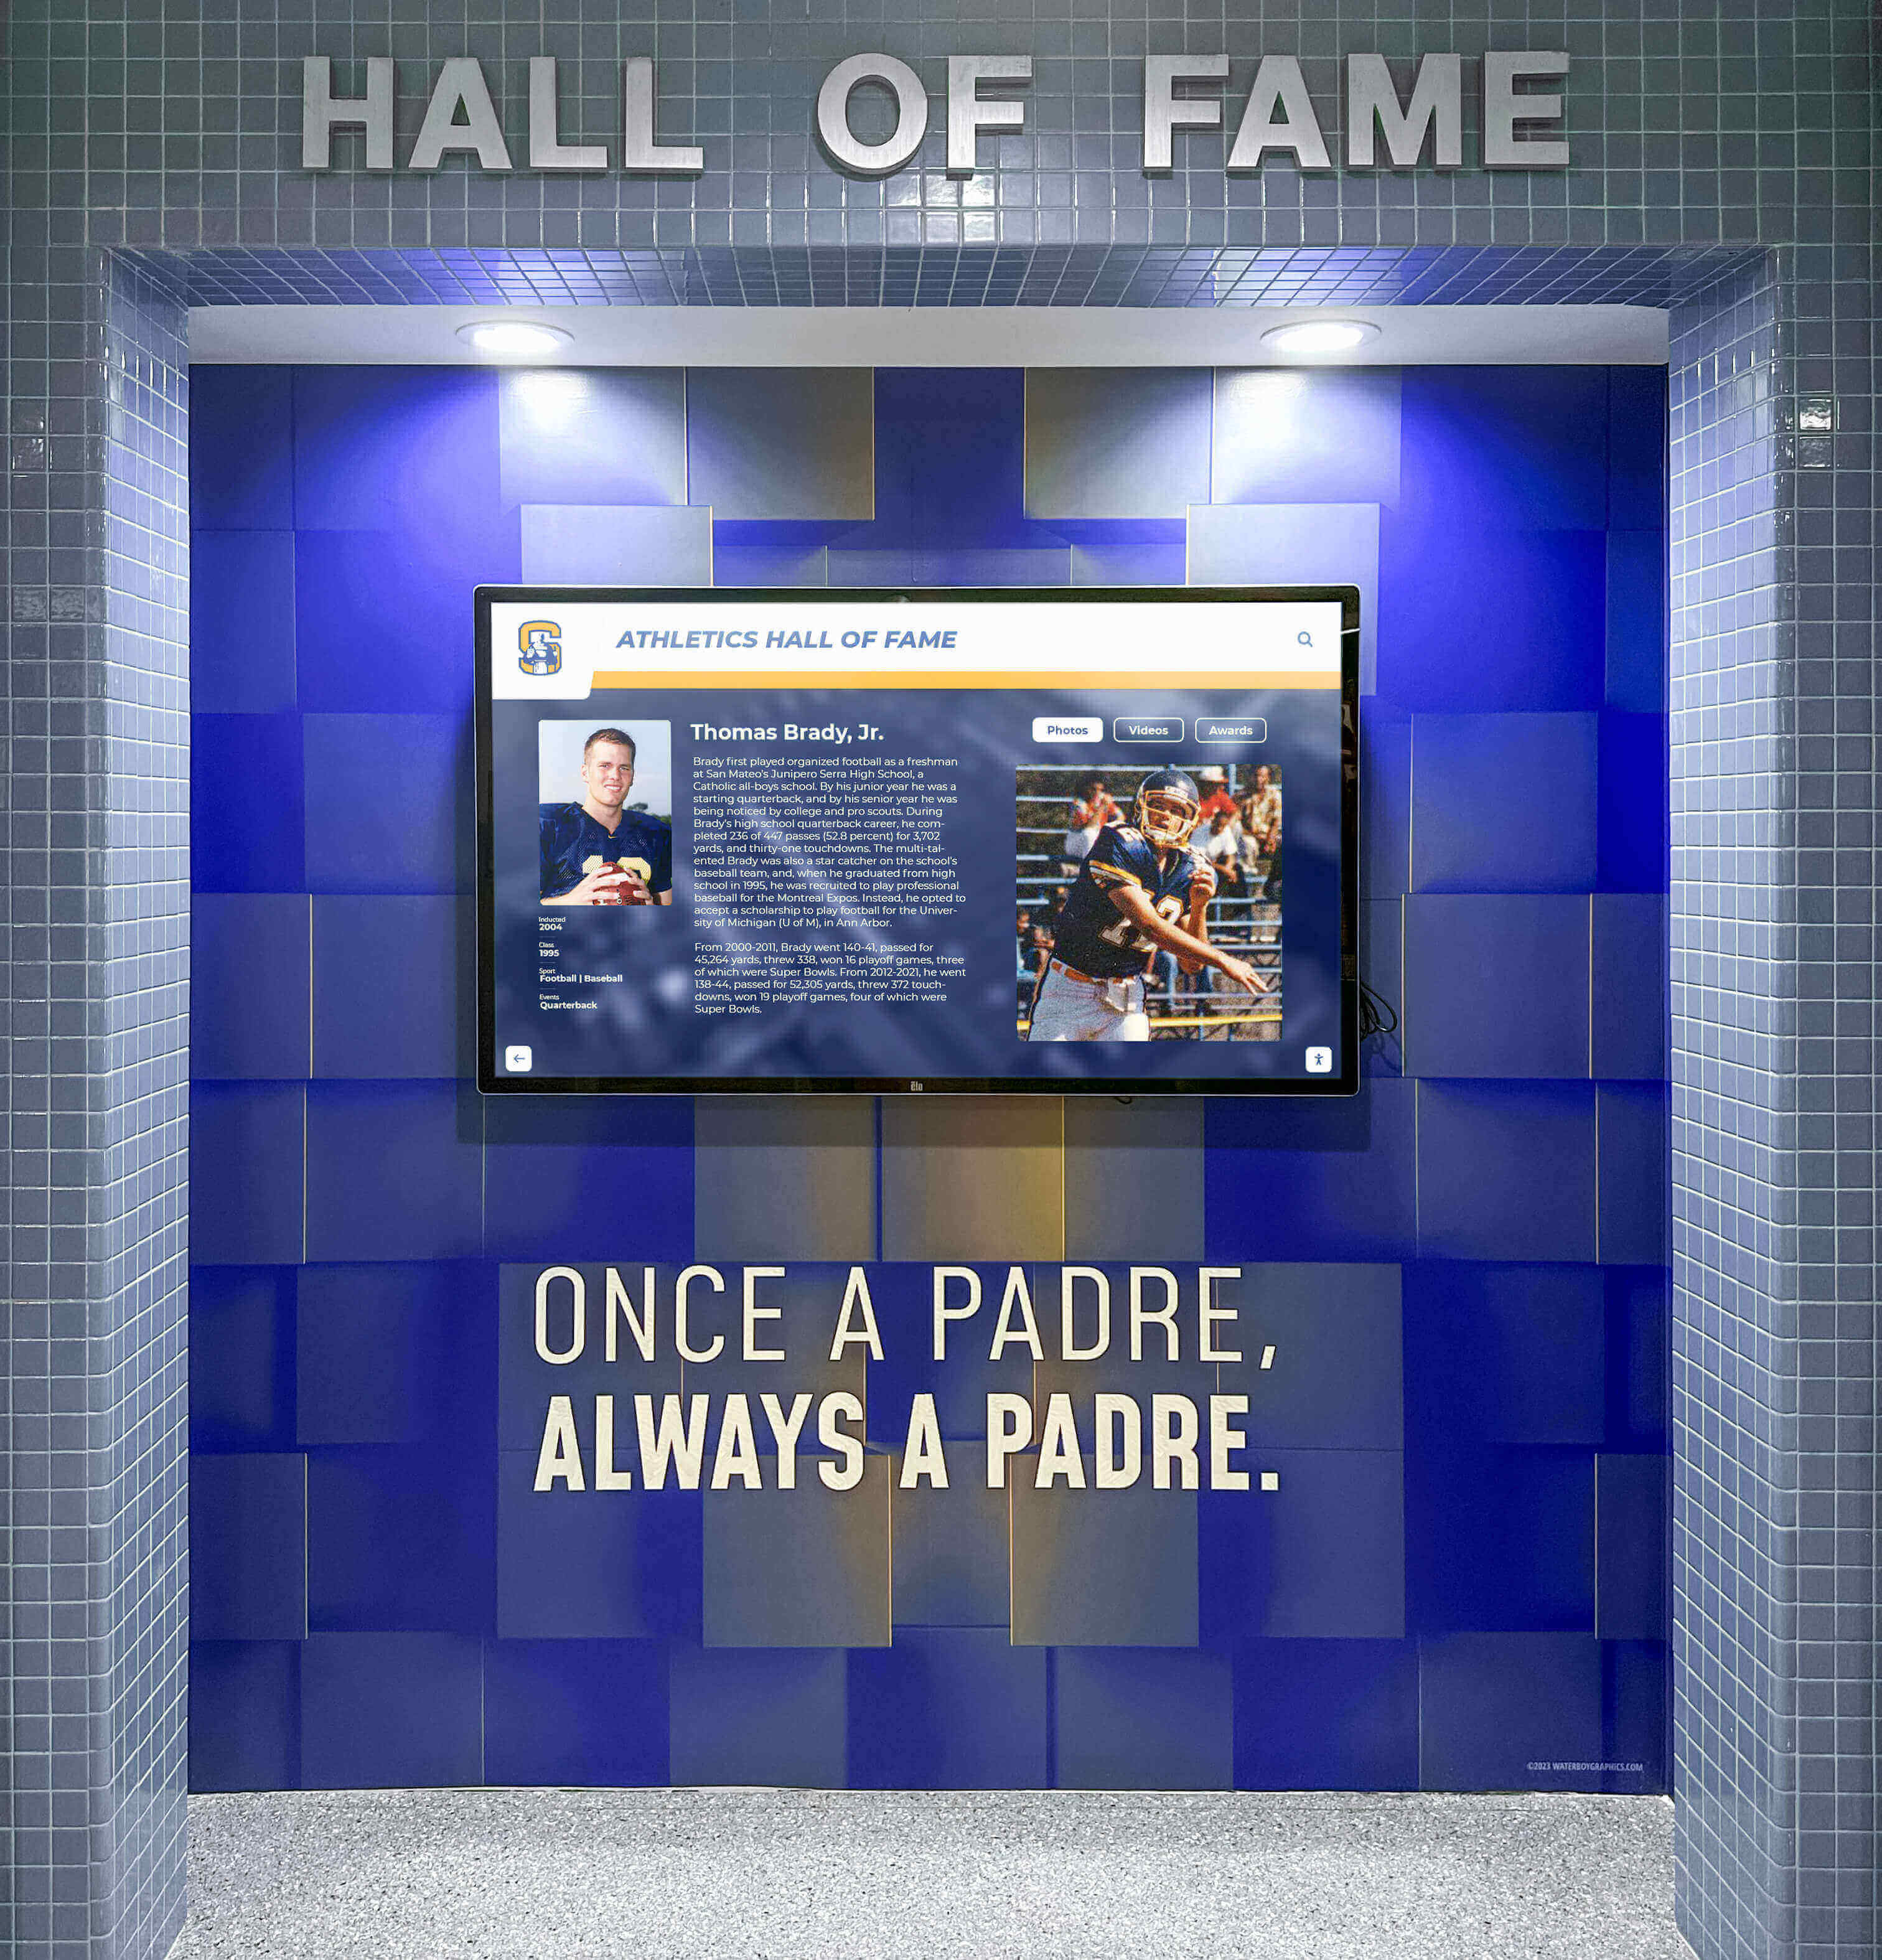
Platform Selection Impact on Engagement
Not all digital record board platforms support every engagement feature. When selecting an interactive kiosk solution, verify:
- Content management access: Can multiple staff members update content remotely?
- Search functionality: Does the system provide comprehensive filtering and search?
- Mobile optimization: Do profiles display correctly on personal devices?
- Scheduling capabilities: Can content change automatically based on dates or events?
- Analytics depth: What engagement metrics does the platform track?
- Integration options: Can the system import data from other campus software?
Solutions like Rocket Alumni Solutions include these engagement features as standard capabilities rather than expensive add-ons. Compare total feature availability, not just hardware costs, when evaluating vendors.
Case Study Framework: Measuring Your Implementation
Document your implementation results using this framework:
Baseline Measurements (Before Digital Display):
- Average visitor engagement time with static displays: _____ seconds
- Records updated per year: _____ updates
- Alumni inquiries about finding their records: _____ per year
- Staff hours spent updating displays: _____ hours per month
Post-Implementation Measurements (After 6 Months):
- Average visitor engagement time: _____ minutes
- Records updated per year: _____ updates
- Alumni engagement with digital profiles: _____ interactions per month
- Staff hours spent updating displays: _____ hours per month
Engagement Feature Performance:
- Most-used search filters: _____
- Most-viewed content categories: _____
- QR code scans to mobile: _____ per month
- Social shares from profiles: _____ per month
Share results with stakeholders to justify investment and guide future improvements.
Scaling Engagement Across Multiple Sports
Schools with extensive athletic programs need strategies to prevent major sports from dominating displays:
Equal Rotation Scheduling
Configure automatic rotation that gives every sport equal screen time:
- 2-minute display windows per sport during general browsing
- Seasonal emphasis (winter sports featured more during winter, but other sports remain accessible)
- Championship achievements from any sport automatically featured for one week
This ensures athletes in less-prominent sports receive recognition comparable to revenue sports. Fair athletic recognition across all programs strengthens overall school spirit.
Sport-Specific Navigation
Provide multiple navigation paths:
- Browse by sport (traditional organization)
- Browse by achievement type (state champions across all sports)
- Browse by year (all sports from a specific season)
- Search by athlete name (bypasses sport hierarchy entirely)
Multiple paths let visitors interested in specific sports dive directly while others explore broadly.
Metric Normalization
Help visitors understand excellence across different sports by providing context:
- Percentile rankings within sport (top 1% of all athletes in program history)
- Comparison to state or conference records
- Longevity of records (records standing 20+ years indicate exceptional performance)
This allows fair comparison between a swimmer’s time and a wrestler’s winning streak even though the metrics differ fundamentally.
Conclusion
Digital record boards transform static lists of names and numbers into interactive experiences that students, athletes, and alumni actually explore when you implement engagement-focused features. The 20 ideas in this guide—from real-time statistics and searchable databases to alumni spotlights and QR code archives—provide specific configurations that increase session duration, encourage repeat visits, and extend recognition beyond your campus.
Start with high-impact, low-cost features like searchable databases and scheduled content rotation. Measure engagement metrics quarterly. Add more sophisticated features like live game integration or user-submitted content after validating that simpler features generate consistent usage. The goal is not implementing every feature, but selecting the ideas that best serve your specific campus community and athletic program culture.
Ready to implement digital record boards that students and alumni actually engage with rather than walk past? Book a demo to explore interactive features designed specifically for educational athletic programs.