Intent: Define Requirements and Calculate Installation Costs for Interactive Storytelling Systems
Campus admissions teams face mounting pressure to differentiate their institutions in an increasingly competitive enrollment landscape. Prospective students tour multiple campuses, compare experiences, and make enrollment decisions based on emotional connections forged during brief campus visits. Yet many institutions still rely solely on verbal narratives from tour guides and static printed materials that fail to create memorable, lasting impressions.
Interactive campus storytelling through touchscreen displays transforms admissions tours by delivering dynamic, engaging narratives about institutional history, student achievements, academic programs, and campus culture—creating immersive experiences that prospective students remember long after leaving campus. This implementation guide provides complete technical specifications, content strategies, placement planning, budget calculations, and installation procedures needed to deploy interactive storytelling systems that measurably boost admissions outcomes.
Admissions directors understand that campus tours serve as critical enrollment touchpoints where prospective students transition from passive researchers to emotionally invested applicants. According to higher education enrollment research, campus visit experiences significantly influence college choice decisions, with interactive, technology-enhanced tours creating stronger institutional connections than traditional verbal-only presentations.
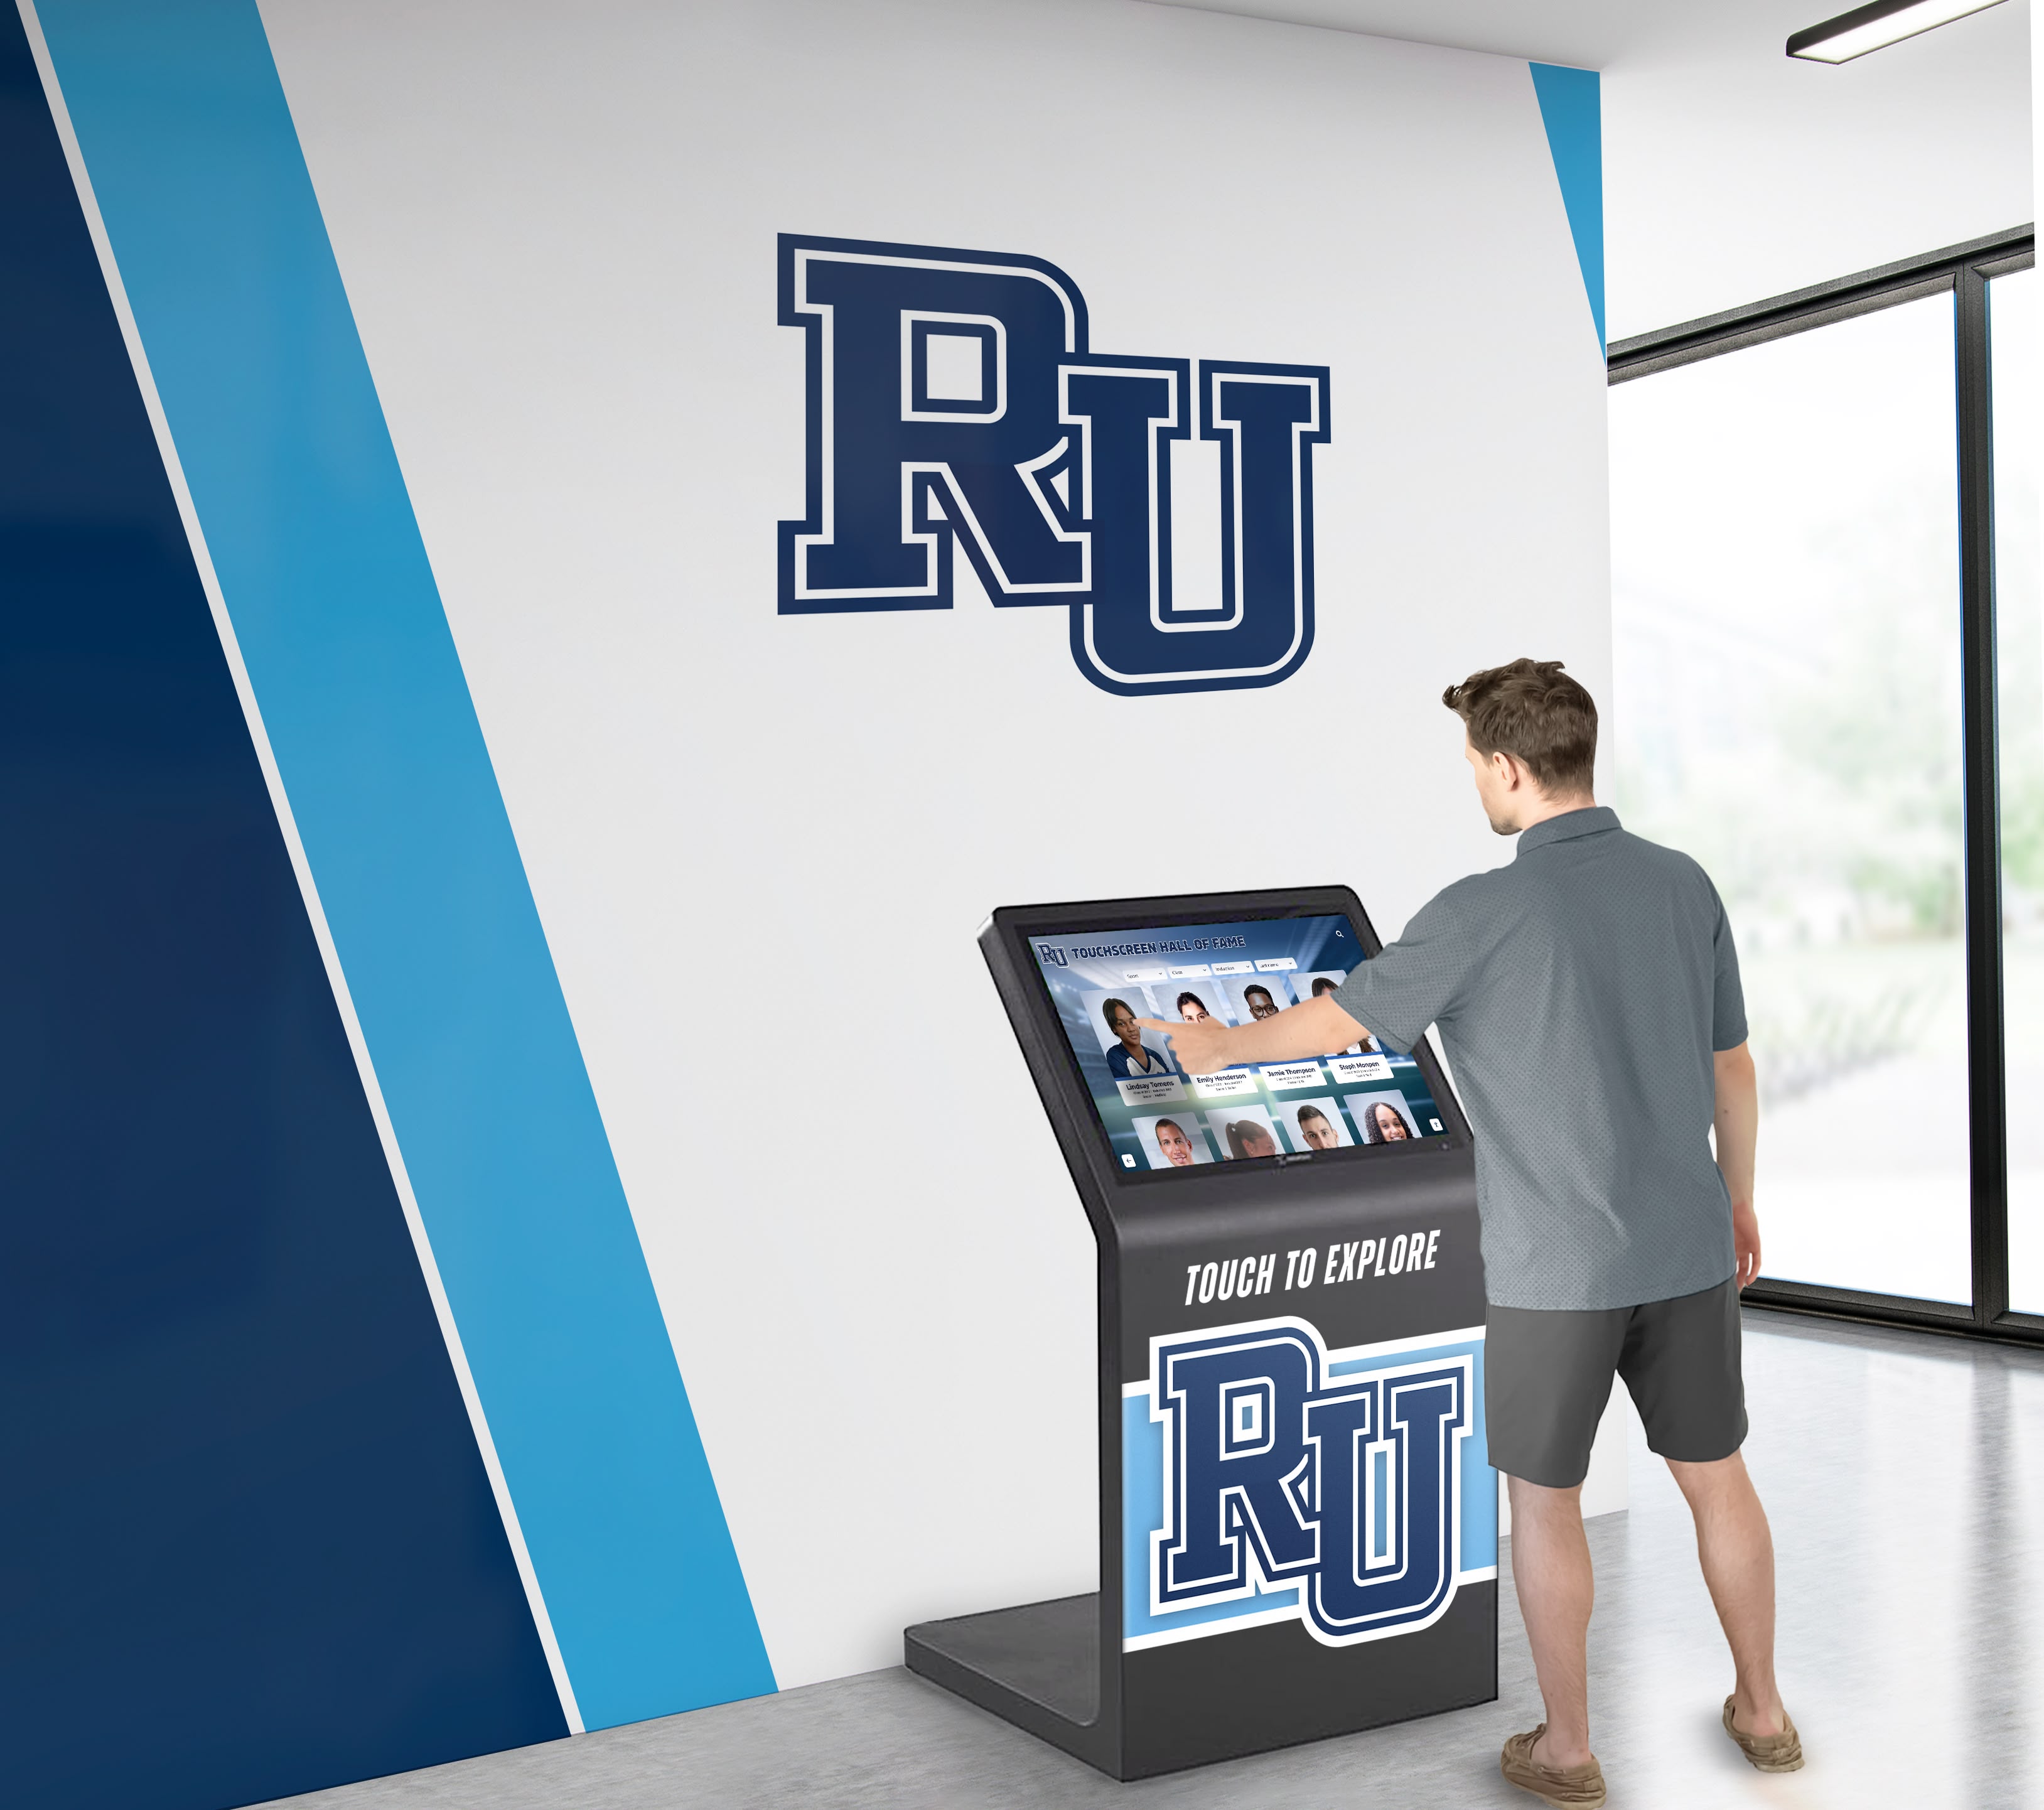
Interactive storytelling displays stationed at strategic tour stops enable admissions teams to deliver consistent, compelling narratives augmented with multimedia content—alumni success stories, historic photos and videos, research highlights, campus traditions, and student testimonials—that tour guides can reference without memorizing extensive details. This technology-human partnership creates richer experiences while reducing guide cognitive load and ensuring message consistency across hundreds of annual tours.
This comprehensive guide walks through every technical decision required to implement interactive storytelling systems optimized for admissions environments—from needs assessment and hardware specification through content strategy, installation execution, and success measurement.
Before You Start: Prerequisites and Planning
Effective interactive storytelling implementations begin with systematic assessment of institutional needs, tour patterns, and technical constraints before selecting technology solutions.
Stakeholder Identification and Requirements Gathering
Interactive storytelling projects require input from multiple departments whose perspectives shape both content direction and technical specifications:
Admissions and Enrollment Management: Primary stakeholders who manage campus visit programs, understand prospective student priorities, control enrollment marketing messages, and measure tour effectiveness. Their participation ensures technology serves actual recruitment objectives rather than representing technology for technology’s sake.
Marketing and Communications: Maintains institutional brand standards, manages visual identity guidelines, controls approved messaging, and produces multimedia content assets. Early involvement ensures displays reinforce rather than conflict with broader institutional marketing.
Facilities and Campus Planning: Controls physical spaces where displays install, manages building access and modifications, coordinates construction or renovation projects affecting placement, and provides infrastructure support for power and network connectivity.
Information Technology: Manages network infrastructure, enforces security policies, supports technical systems, provides ongoing maintenance, and ensures cybersecurity compliance. IT engagement from project initiation prevents deployment delays caused by network access issues or unapproved software.
Institutional Advancement and Alumni Relations: Provides alumni success stories, fundraising narratives, donor recognition content, and historical institutional materials that enrich storytelling beyond current student perspectives. Advancement collaboration ensures comprehensive institutional narrative representation.
Schedule initial cross-functional meeting documenting current tour challenges, identifying storytelling content priorities, clarifying technical constraints and requirements, establishing content governance responsibilities, and securing budget commitment from appropriate departments sharing investment benefits.
Tour Program Analysis and Pain Point Documentation
Understanding existing campus tour operations reveals where interactive storytelling delivers maximum value:
Current Tour Format Assessment: Document typical tour duration and routing, group sizes and visitor demographics, tour guide training and backgrounds, seasonal demand patterns and peak periods, and information consistently emphasized across tours. This baseline reveals which tour elements benefit most from technology enhancement versus elements best delivered through personal guide interaction.
Information Delivery Challenges: Identify content complexity exceeding verbal communication effectiveness, visual materials currently unavailable during tours, inconsistent messaging across different tour guides, questions frequently asked requiring detailed responses, and memorable storytelling opportunities currently unrealized due to time or format constraints.
Physical Environment Constraints: Map tour routes and typical stop locations, assess weather impact on outdoor tour segments, evaluate ADA accessibility throughout routes, identify high-traffic congestion areas, and document competing distractions affecting visitor attention during tours.
Competitive Positioning Analysis: Research tour experiences offered by peer institutions, identify technology use by competitor admissions programs, understand prospective student expectations shaped by previous campus visits, and establish differentiation opportunities where enhanced storytelling creates enrollment advantages.
Comprehensive analysis of campus tour technology implementations provides frameworks for evaluating institutional tour enhancement opportunities.
Content Inventory and Storytelling Asset Assessment
Effective interactive storytelling requires substantial multimedia content representing institutional narrative comprehensively:
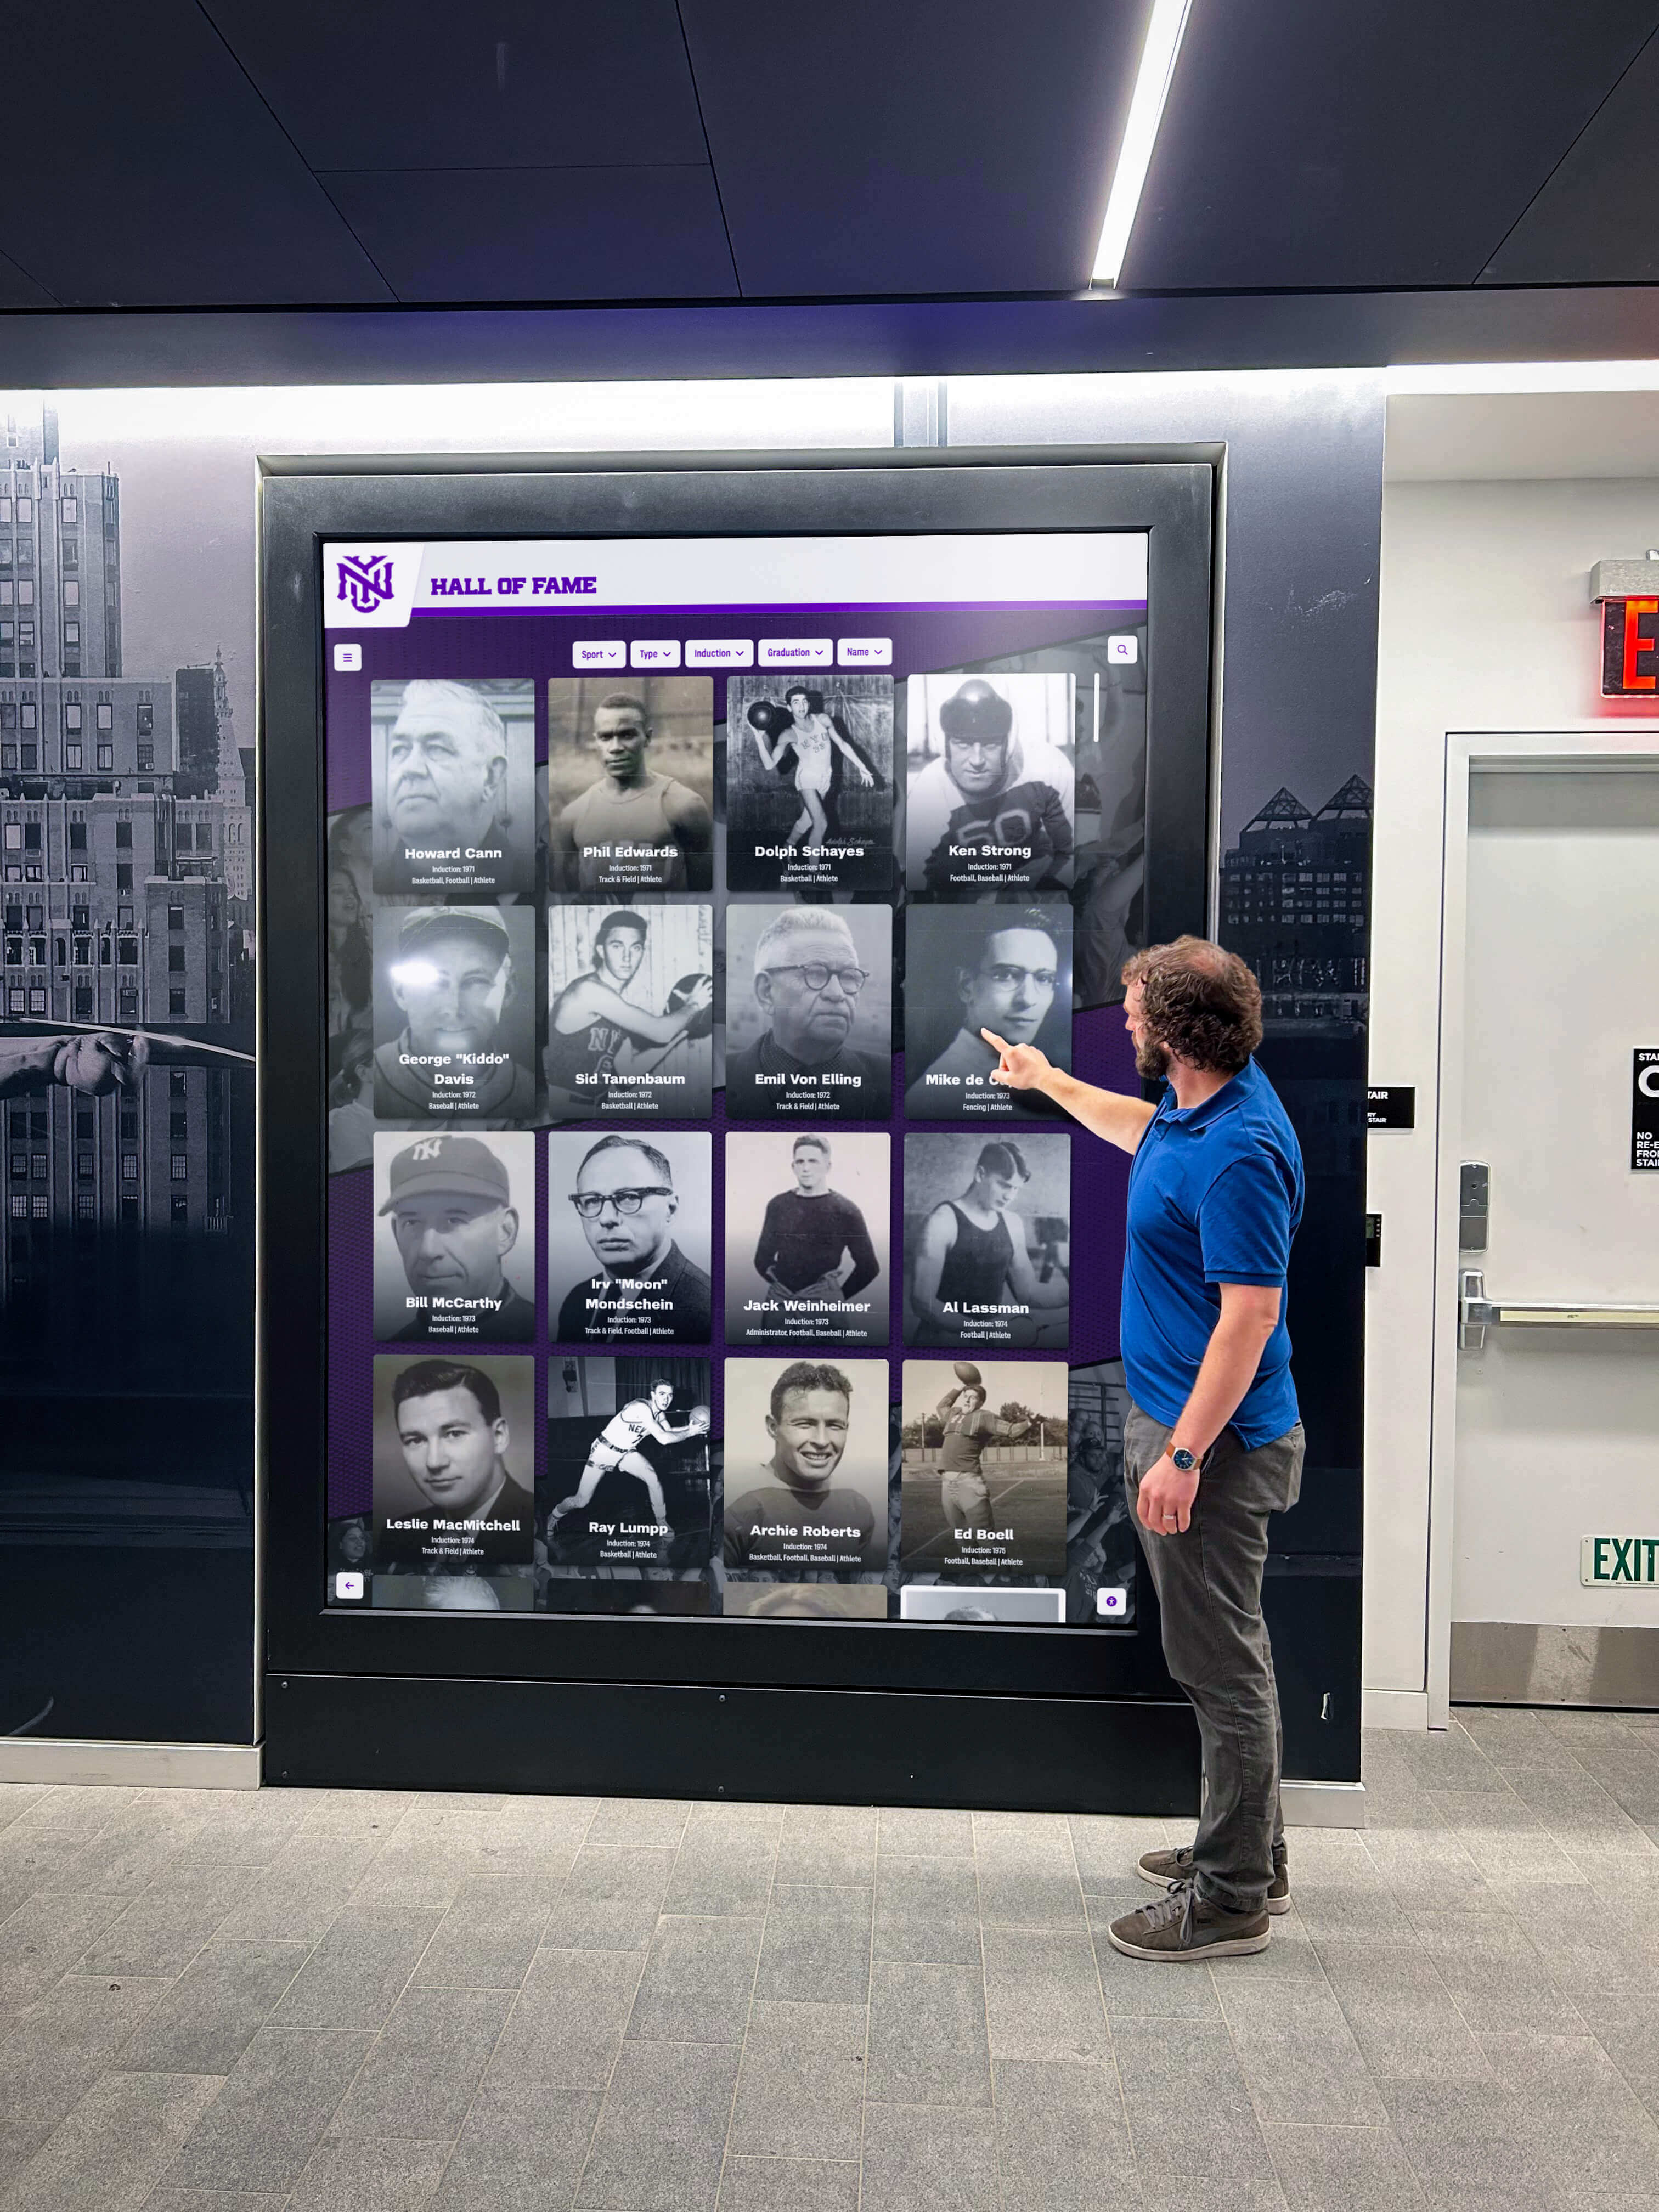
Historical Materials and Archives: Collect historic photographs documenting institutional founding and development, yearbook materials showing student life evolution, architectural documentation of campus buildings, significant event records and commemorations, and milestone achievement documentation. These materials anchor institutional heritage narratives connecting prospective students to tradition and legacy.
Current Student Life Documentation: Gather student testimonial videos and interviews, club and organization documentation, campus event photography and videography, academic program highlights and outcomes, research project showcases and faculty expertise profiles, and athletic achievement recognition. Contemporary content helps prospects envision themselves as community members engaged in current campus life.
Alumni Success Stories: Compile graduate career outcome data, notable alumni achievement profiles, professional network testimonials, alumni video messages for prospective students, and geographic representation showing diverse career paths. Alumni content demonstrates concrete value propositions—proving how institutional experience translates to post-graduation success.
Statistical and Outcome Data: Document academic program rankings and accreditations, employment rates and graduate school placement statistics, average starting salaries by major, student-faculty ratios and class size data, research funding and publication metrics, and retention and graduation rate information. Data-driven storytelling appeals to analytically-minded prospects and parents evaluating educational return on investment.
Identify content gaps requiring new production versus existing materials ready for digital presentation. Budget adequate time and resources for professional content creation filling narrative gaps that weaken overall storytelling impact.
Infrastructure Assessment at Proposed Installation Locations
Verify technical requirements can be met at each intended display location before finalizing placements:
Electrical Power Availability: Interactive displays typically require 120V standard outlets with dedicated 15-amp circuits. Document existing outlets near proposed locations, distance from power sources to mounting positions, circuit capacity for additional load, and costs for new electrical installations if existing infrastructure inadequate.
Network Connectivity Requirements: Display content management, software updates, and analytics reporting require reliable network access. Assess wired ethernet availability (preferred for reliability), WiFi coverage and signal strength at locations, network security policies affecting device authentication, bandwidth sufficiency for content updates and video streaming, and IT requirements for network segmentation or VLAN configuration.
Physical Mounting Feasibility: Evaluate wall construction types (drywall, concrete, brick, glass) affecting mounting hardware selection, structural capacity for display weight (50-150 pounds for commercial units), ceiling height considerations for vertical displays, floor space availability for freestanding kiosks with adequate clearance, and ADA compliance requirements for reach ranges and approach clearances.
Environmental Conditions: Consider ambient lighting conditions affecting screen brightness requirements, temperature ranges especially near building entrances, humidity exposure risks, weather protection needs for semi-outdoor installations, and vandalism risk factors in unsupervised public areas.
Create standardized site survey checklist documenting these factors for every proposed location, enabling accurate hardware specifications and realistic installation budgeting.
Hardware Specification for Admissions Storytelling Displays
Commercial-grade hardware designed for continuous public operation delivers reliability that consumer products cannot match in demanding campus environments.
Commercial Touchscreen Display Requirements
Screen Size Selection for Tour Group Visibility:
- 43-49 inch displays suit smaller admissions center lobbies and intimate tour stop locations where groups approach within 3-6 feet
- 55-65 inch screens serve larger gathering spaces, building entrances, and outdoor tour stops where visitors view from 6-12 feet distances
- 70+ inch displays work for auditoriums, large atrium spaces, or showcase installations requiring visibility from 15+ feet
Brightness Specifications for Varied Lighting: Commercial displays rated 400-700 nits ensure readability across diverse campus environments including bright lobbies with extensive natural light, dim corridors with limited illumination, outdoor installations requiring maximum brightness, and transition spaces between indoor and outdoor areas. Consumer displays typically rated 200-350 nits prove nearly unreadable in bright conditions common throughout campus environments.
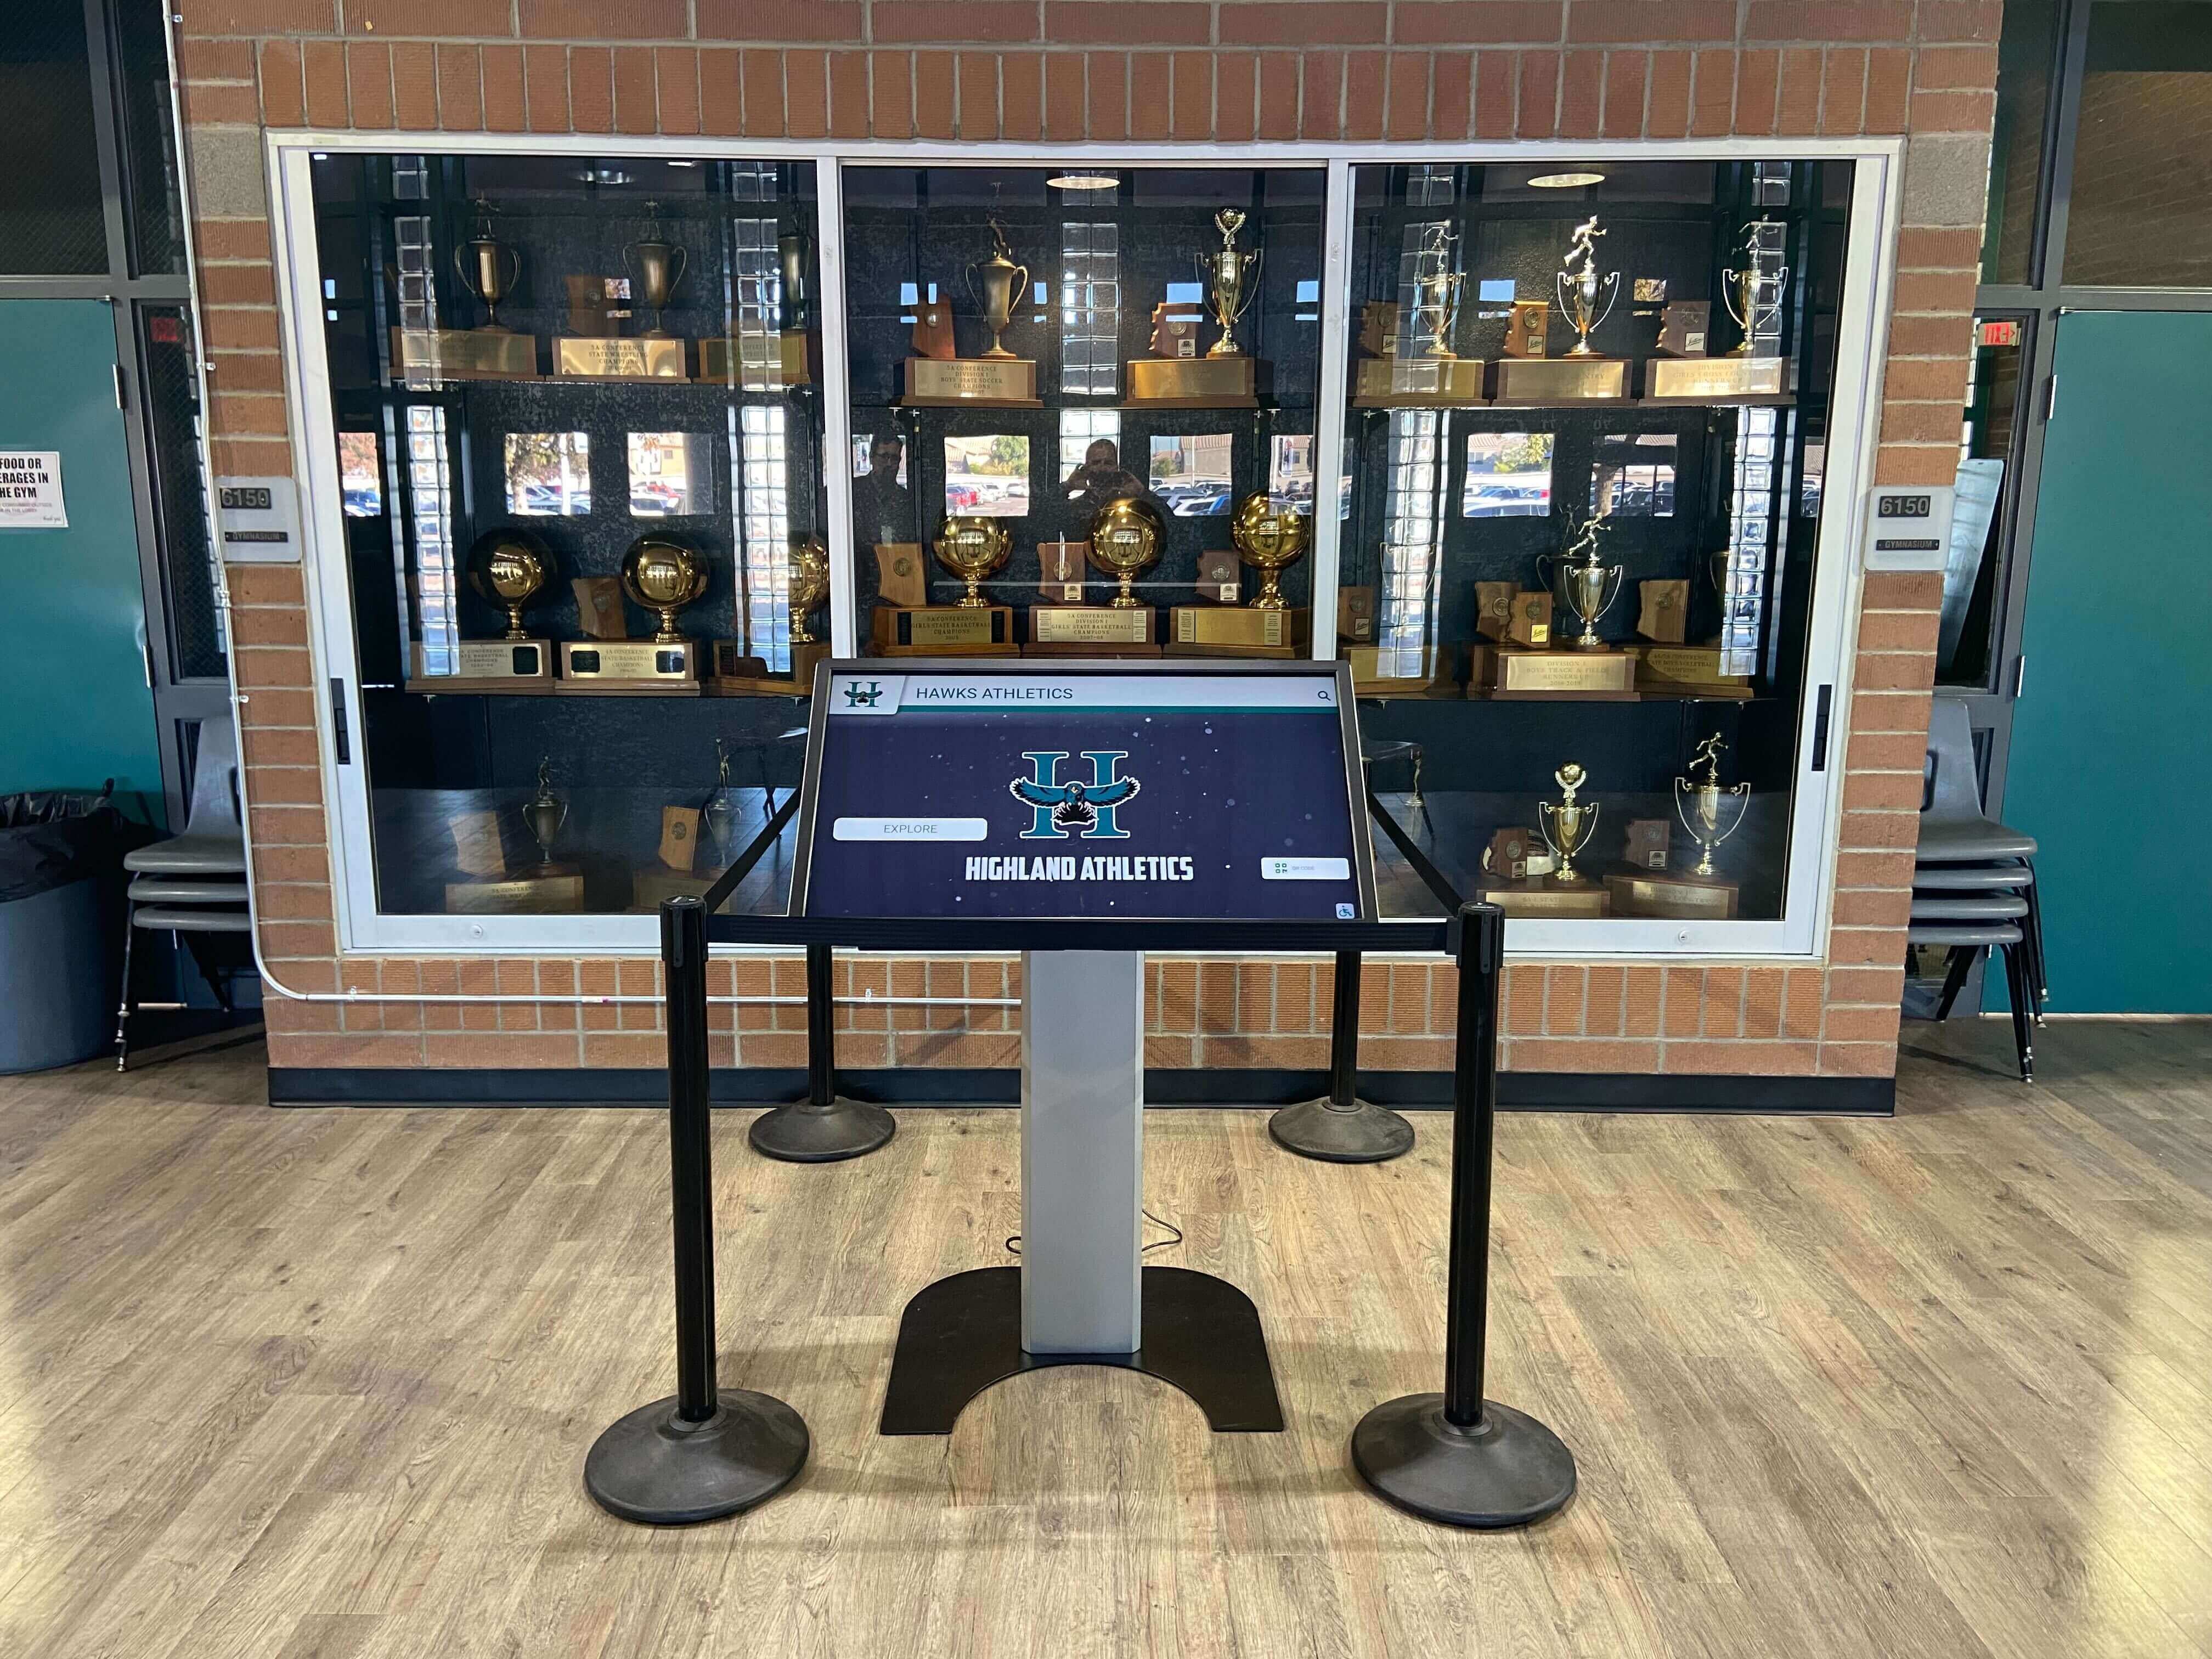
Touch Technology for Public Use: Projected capacitive (PCAP) touchscreens provide responsive multi-touch support, extreme durability withstanding heavy public use, accurate touch detection across entire screen surface, and immunity to surface scratches affecting alternative touch technologies. Specify industrial-grade PCAP screens rated for 50+ million touch operations—consumer touchscreens commonly fail within 12-18 months under intensive public use.
Continuous Operation Rating: Commercial displays engineered for 24/7 operation include industrial cooling systems preventing thermal damage, components rated for extended lifespans (50,000+ hours versus 10,000-20,000 hours for consumer displays), and warranties covering continuous rather than intermittent operation. This reliability proves essential when displays form integral parts of admissions programs where downtime creates negative impressions.
Audio Integration Capabilities: Storytelling content frequently includes video testimonials, narrated historical segments, and multimedia presentations requiring quality audio. Specify displays with built-in speakers suitable for small group viewing (typically 10-20 watts), audio output connections for external speakers in larger spaces, adjustable volume controls accessible to tour guides, and option for headphone jacks enabling individual audio access without disturbing other campus activities.
Guidance on selecting touchscreen hardware for educational settings addresses institution-specific requirements and budget optimization strategies.
Computing Hardware and Content Delivery Systems
Touchscreen displays require computing power to run interactive software, process user interactions, and deliver multimedia content smoothly:
Embedded Computing Options: System-on-chip displays integrate computing directly into screen enclosures, eliminating separate media players while simplifying installation and reducing potential failure points. Verify specifications include:
- Minimum 4GB RAM (8GB preferred for video-heavy content)
- 64GB+ SSD storage for multimedia content libraries
- Intel i5 or ARM equivalent processors
- Gigabit ethernet and dual-band WiFi
- Fanless passive cooling for silent operation
External Media Player Specifications: Separate computing hardware offers performance advantages for demanding interactive applications, easier component upgrades without replacing entire displays, and flexibility replacing computing elements independently. Specify commercial-grade players including:
- Intel i5 or i7 processors (or AMD Ryzen equivalent)
- 8-16GB RAM for smooth multimedia playback
- 128GB+ NVMe SSD storage
- Dedicated GPU for video processing (optional but recommended)
- Industrial temperature range for varied installation environments
- VESA mounting capability for behind-display installation
Content Management and Delivery Architecture: Modern interactive storytelling systems typically deploy cloud-based content management enabling remote updates, scheduled content publishing, multi-display coordination, usage analytics collection, and centralized administration without requiring on-site server infrastructure. Coordinate with IT regarding cloud service approval, data security requirements, and backup strategies.
Kiosk Enclosures and Professional Mounting Systems
Hardware protection and professional presentation require appropriate enclosures and mounting solutions:
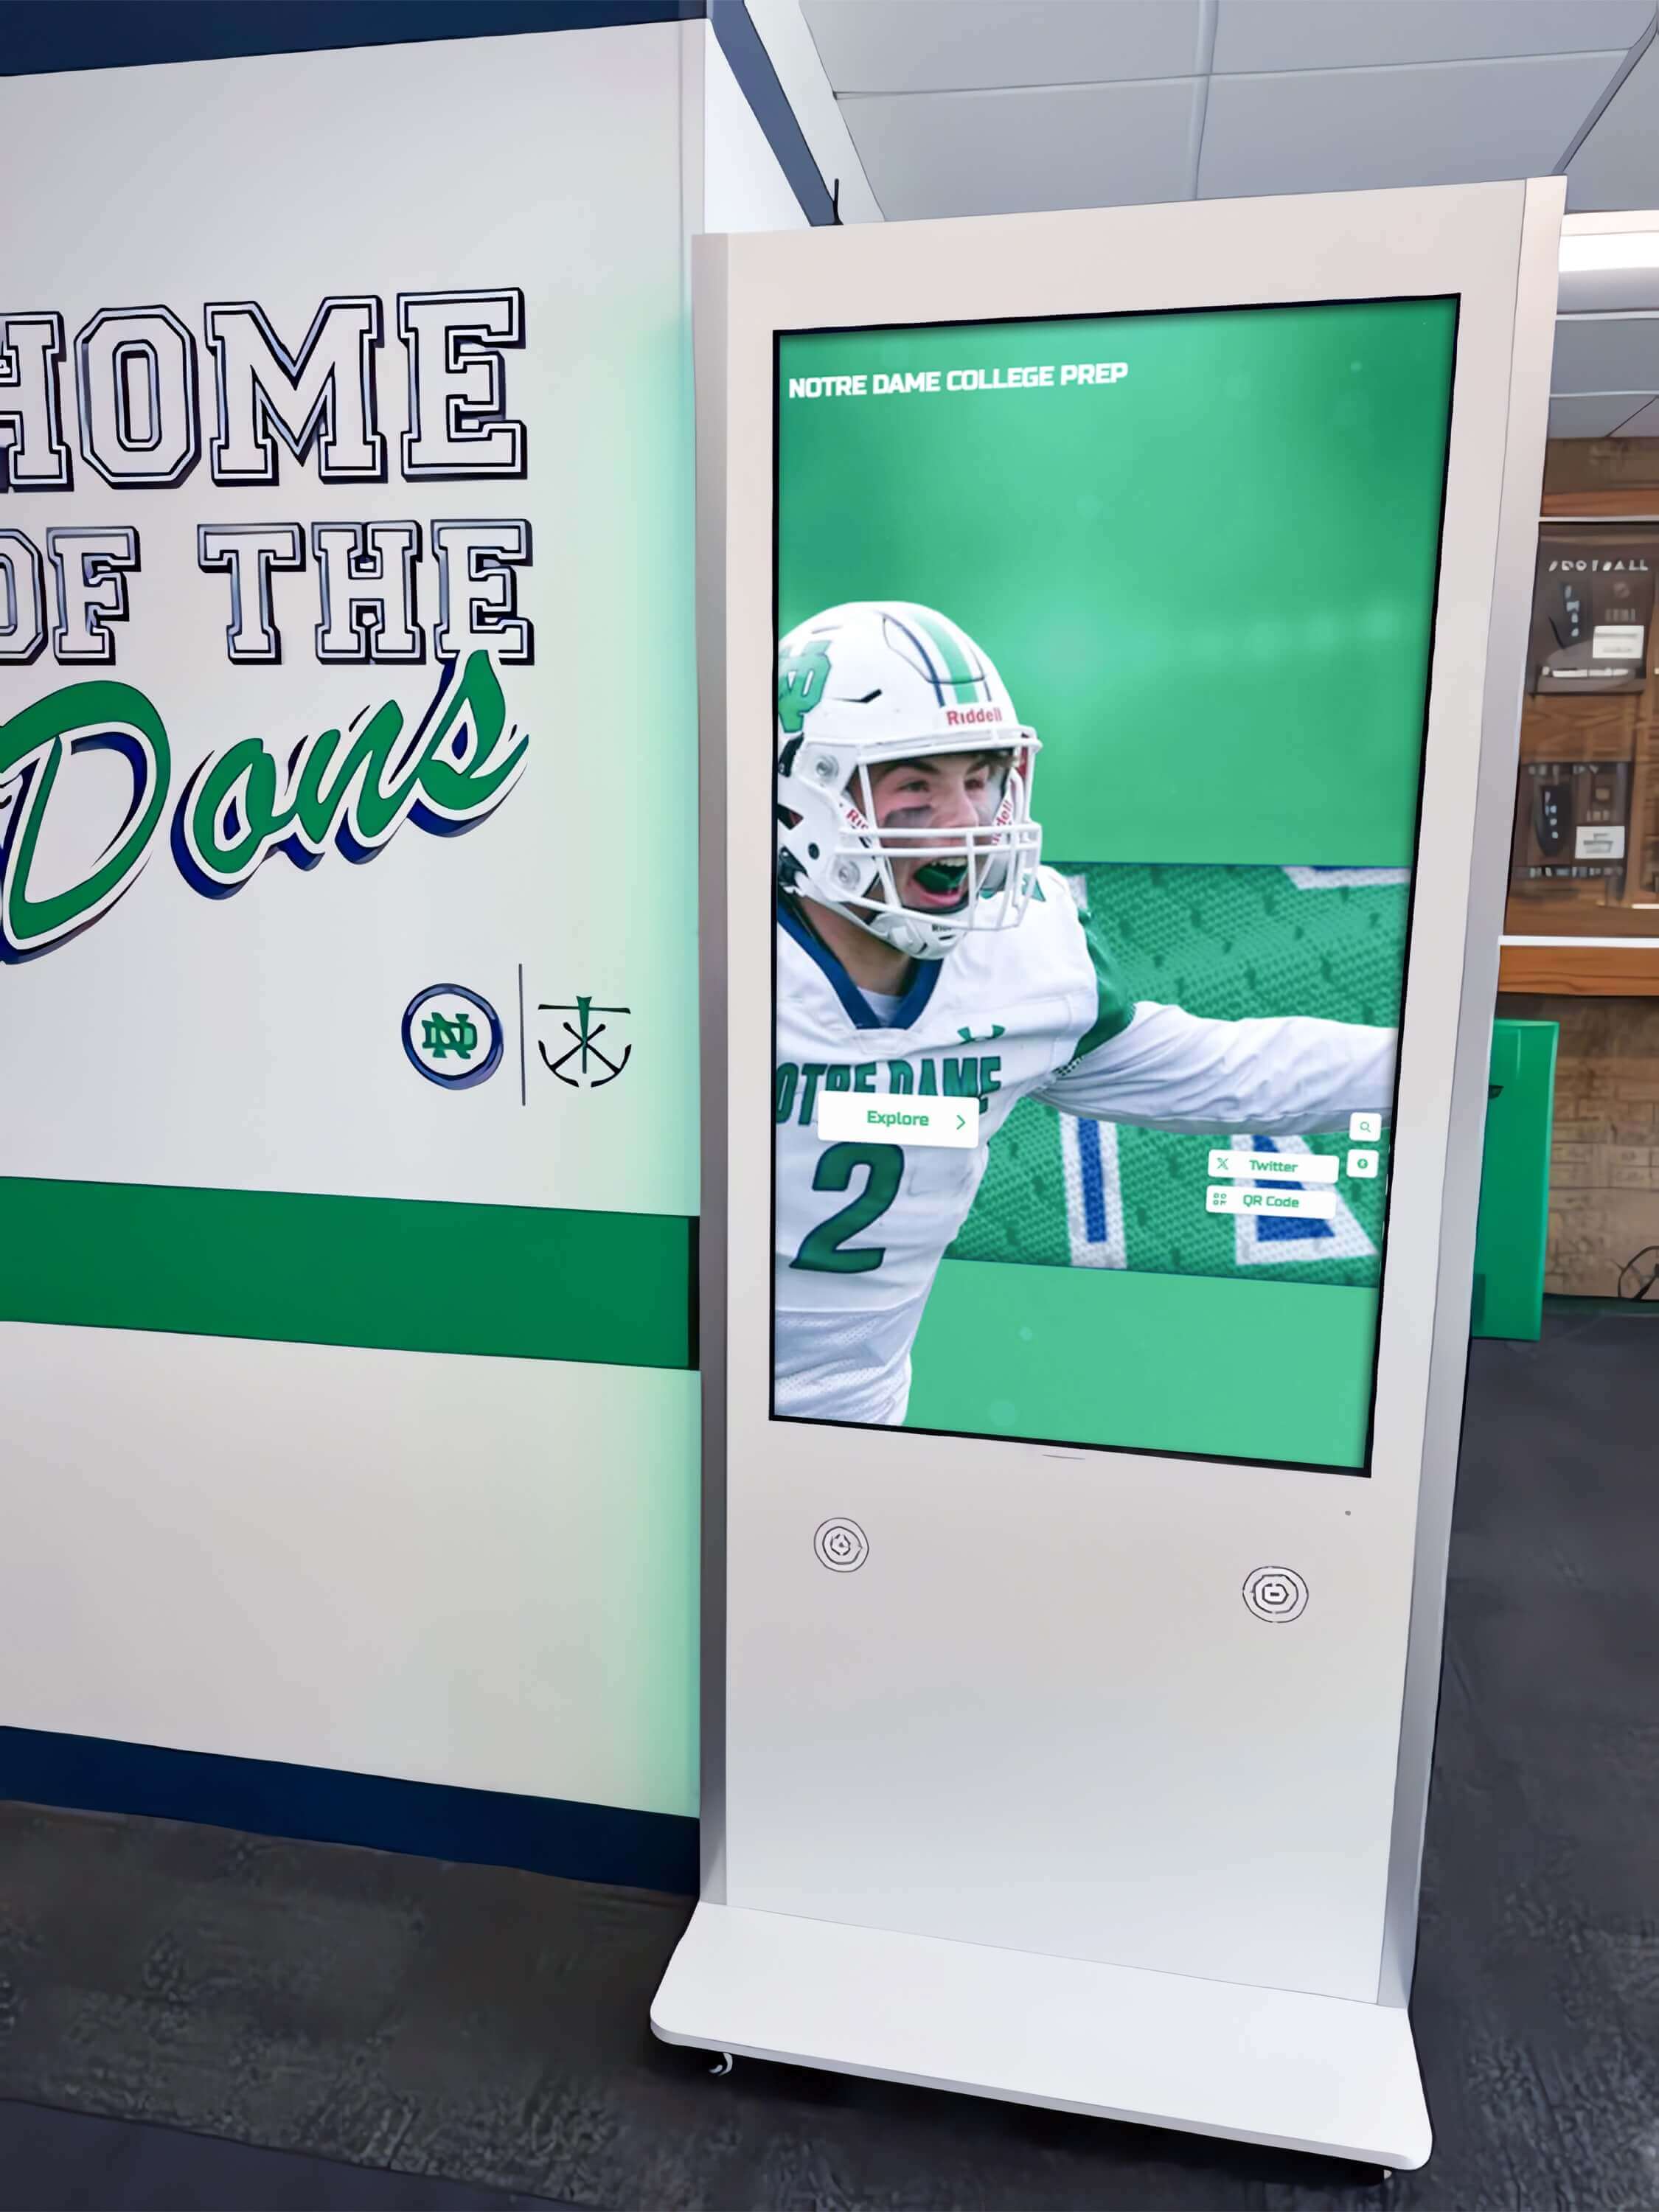
Freestanding Kiosk Enclosures: Floor-mounted units integrate displays, computing hardware, cable management, and weighted bases in self-contained packages. Advantages include:
- No wall mounting requirements or structural modifications
- Portability enabling seasonal relocation or event redeployment
- Prominent positioning in open spaces maximizing visibility
- Professional appearance communicating institutional investment
Disadvantages: Higher initial cost ($3,000-$8,000 for quality commercial units), larger physical footprint requiring more floor space, and greater vandalism vulnerability in unsupervised locations.
Wall-Mount Solutions: Direct wall mounting reduces spatial footprint, costs less than freestanding kiosks ($1,500-$3,500 including professional installation), and provides security through elevated positioning. Requirements include:
- Sufficient structural support (mounting to wall studs or blocking required)
- Professional installation ensuring level mounting and cable concealment
- Height optimization balancing standing ergonomics with ADA reach requirements
- Cable management concealing power and network connections
Outdoor-Rated Weatherproof Enclosures: Displays at outdoor tour stops or near building entrances require specialized protection including:
- IP65 minimum weatherproof rating
- Integrated heating and cooling maintaining operating temperatures
- Anti-glare screens with 1000+ nit brightness
- Vandal-resistant construction with tamper-proof fasteners
- Drainage systems preventing moisture accumulation
Outdoor installations typically cost 2-3x indoor equivalents but position storytelling exactly where tour groups gather, maximizing engagement when prospects’ attention naturally focuses on tour content.
Budget frameworks for institutional interactive display implementations demonstrate typical hardware cost ranges across installation types and scales.
Software Platform Selection and Content Management
Hardware provides infrastructure, but software determines user experience quality, content flexibility, and long-term administrative burden.
Essential Interactive Storytelling Software Capabilities
Effective platforms must provide features specifically supporting admissions storytelling rather than generic digital signage:
Intuitive Content Authoring Tools: Non-technical admissions staff must create and update storytelling content without requiring design expertise, coding knowledge, or IT support. Essential authoring features include:
- Drag-and-drop content layout builders
- Professional design templates for consistent presentation
- Media library management for photos, videos, and documents
- Text editing with formatting controls (headlines, paragraphs, captions)
- Preview functionality showing exactly how content appears on displays
- Version control preserving content history and enabling rollbacks
Multimedia Support and Performance: Storytelling content incorporates diverse media requiring smooth playback without technical hiccups that undermine professional presentation:
- High-resolution photo display supporting 4K images
- Video playback with common formats (MP4, MOV, WebM) without transcoding requirements
- Audio synchronization for narrated content
- Smooth transitions between content sections and stories
- Gesture support for intuitive touch interactions (swipe, pinch-to-zoom, tap)
- Fast load times preventing frustrating delays during tours
Narrative Structure and Navigation Design: Unlike generic information displays, storytelling platforms must enable coherent narrative flows guiding visitors through institutional stories:
- Chapter or section organization for thematic storytelling
- Timeline interfaces for chronological historical narratives
- Category-based browsing (academics, student life, athletics, research)
- Featured content highlighting for priority messaging
- Search functionality enabling quick access to specific topics
- Breadcrumb navigation showing location within larger narrative structures
Personalization and Tour Integration: Advanced systems adapt content presentation based on visitor interests or tour guide control:
- Tour guide remote control enabling content selection from smartphones
- Interest-based content recommendations (prospective major, geographic origin, demographics)
- Bookmark functionality allowing prospects to email selected content to themselves
- QR code generation enabling mobile content continuation
- Analytics tracking which stories generate most engagement
Comprehensive reviews of interactive display software platforms compare capabilities across available solutions for educational environments.
Cloud-Based Management vs. On-Premises Deployment
Software architecture affects administration workflows, IT resource requirements, and long-term operational costs:
Cloud-Based Systems (Recommended for Most Institutions):
Advantages:
- Remote content administration from any location—admissions staff update displays from offices rather than visiting each location
- Automatic software updates and security patches without IT intervention
- Minimal infrastructure requirements beyond network connectivity
- Vendor-managed hosting, backup, and disaster recovery
- Scalability adding displays without server capacity planning
- Mobile administration via smartphones and tablets
- Reduced total cost of ownership over multi-year deployments
Considerations:
- Requires reliable internet connectivity at display locations
- Ongoing subscription costs versus one-time licensing
- Potential data residency concerns for sensitive content (rarely applicable for admissions storytelling)
On-Premises Deployment:
Advantages:
- Complete institutional control over data and systems
- One-time licensing potentially reducing long-term costs (5+ year timeframes)
- Independence from internet connectivity for basic operation
- Compliance with strict data governance policies if required
Considerations:
- Requires dedicated server infrastructure and IT management
- Manual software updates and security patching burden
- IT staff time for maintenance, troubleshooting, and user support
- Higher upfront capital investment
- Scalability limitations based on server capacity
- More complex administration requiring technical expertise
Most educational institutions find cloud-based solutions more cost-effective and manageable given typical IT resource constraints and distributed admissions staff needing content access. Reserve on-premises consideration for institutions with exceptional IT resources, existing robust digital signage infrastructure, or specific policies prohibiting cloud services.
Integration with Admissions Systems and CRM Platforms
Maximum storytelling value emerges when interactive displays connect with broader admissions technology ecosystems:
CRM Integration for Personalized Experiences: Connection to admissions CRM systems (Slate, Salesforce, Technolutions) enables:
- Customized welcome messages displaying prospect names and interests
- Content recommendations based on intended majors or programs
- Visit tracking automatically logging which prospects engaged with displays
- Lead scoring adjustments based on display interaction depth
- Follow-up automation sending referenced content via email after tours
Tour Registration System Synchronization: Integration with visit scheduling platforms provides:
- Automated display activation before scheduled tours begin
- Group-specific content loading for specialized tours (athletic recruits, honors program prospects, transfer students)
- Guide notifications when interactive content ready for group
- Attendance tracking correlating tour participation with display engagement
Analytics Platform Connection: Data feeds to institutional analytics systems enable:
- Cross-platform visitor journey tracking
- Conversion funnel analysis from campus visit through application to enrollment
- ROI calculation comparing technology investment with enrollment outcomes
- A/B testing different content approaches measuring engagement effectiveness
- Demographic analysis revealing which prospect segments engage most with interactive storytelling
Work with software vendors and IT to document available APIs, authentication requirements, data mapping specifications, and integration timelines for connecting interactive displays to existing admissions infrastructure.
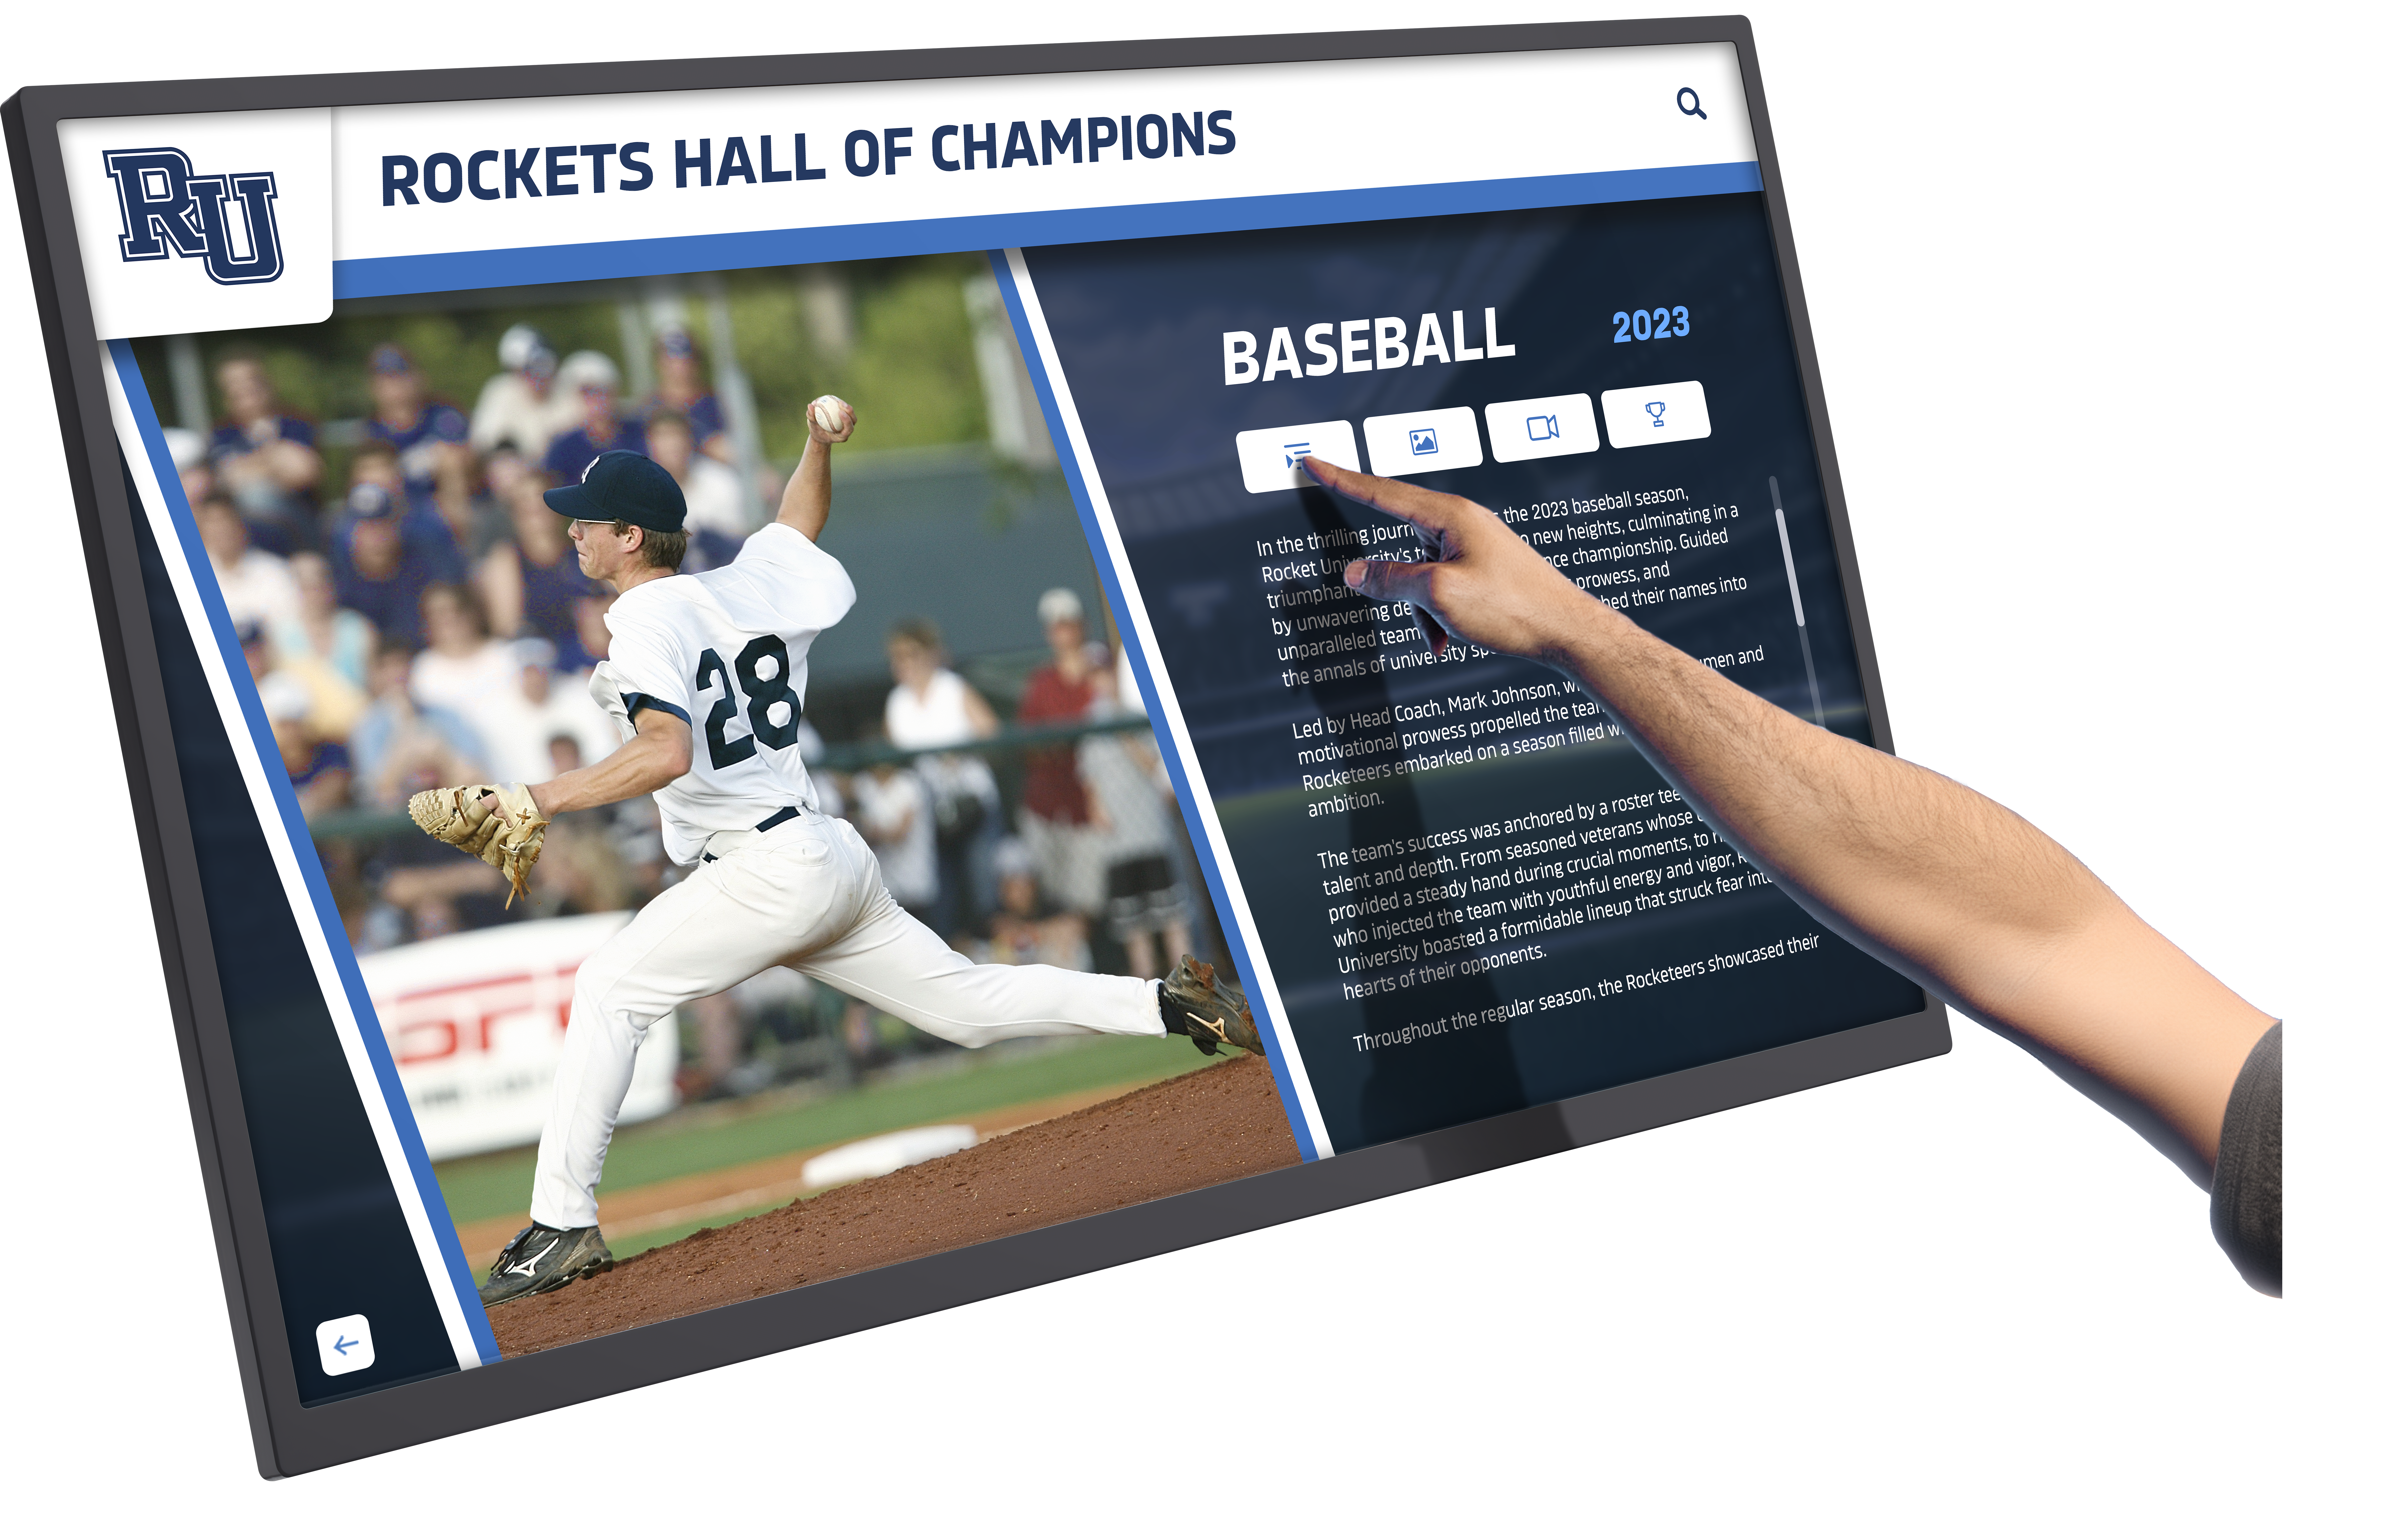
Strategic Placement Planning for Maximum Enrollment Impact
Display effectiveness depends critically on positioning within campus environments where prospective students naturally focus attention during tour experiences.
High-Priority Installation Locations for Admissions Tours
Implement interactive storytelling displays first at locations delivering maximum recruitment value:
Tier 1 - Essential Locations (Implement First):
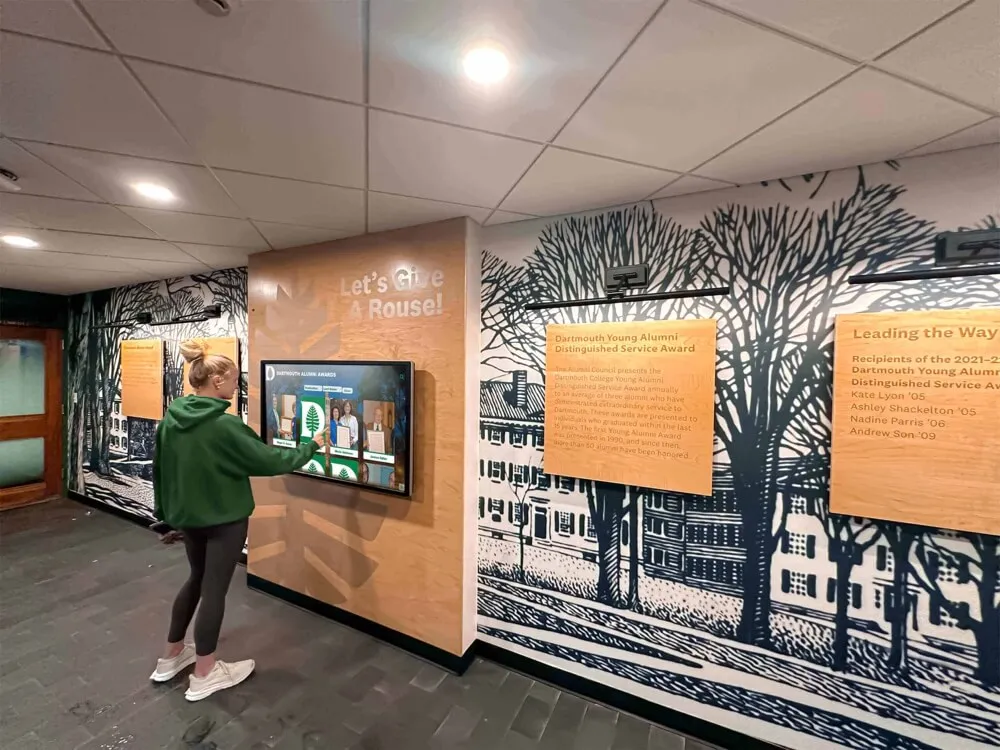
Admissions Office Lobby and Waiting Areas: Prospective students and families spend significant time in admissions spaces before tours, during information sessions, and waiting for appointments. Interactive displays transform waiting time into engagement opportunities—visitors explore institutional stories, review academic program details, and watch student testimonials while tour groups assemble. This productive pre-tour engagement primes visitors emotionally before guided portions begin.
Primary Campus Entrance and Gateway Locations: First impressions form at entry points where visitors arrive on campus. Welcome displays featuring institutional overview stories, campus map orientation, tour meeting information, and immediate “wow factor” through impressive technology establish positive initial perceptions. Gateway installations signal institutional investment in visitor experience and technological sophistication.
Central Campus Commons and Signature Gathering Spaces: Tour routes typically pass through or pause at central campus locations—main quads, student centers, historic landmarks, or symbolic spaces representing institutional identity. These natural tour stops provide ideal venues for storytelling displays that tour guides reference without time pressure, enabling groups to spend 5-10 minutes deeply engaging with content while resting between walking segments.
Tier 2 - High-Value Locations (Implement Second):
Academic Building Entrances for Key Programs: Displays outside signature academic buildings enable targeted storytelling about specific colleges, departments, or programs. Engineering building displays showcase research facilities, faculty expertise, and graduate career outcomes. Business school displays highlight corporate partnerships, experiential learning, and alumni professional success. Targeted placement connects physical facilities to educational value propositions.
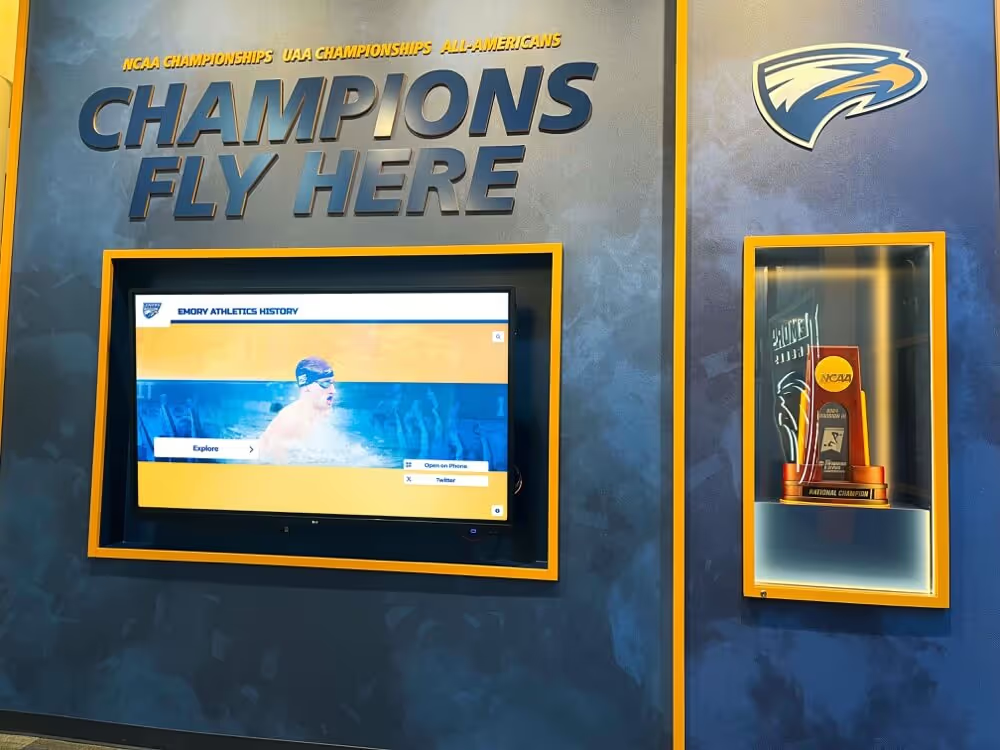
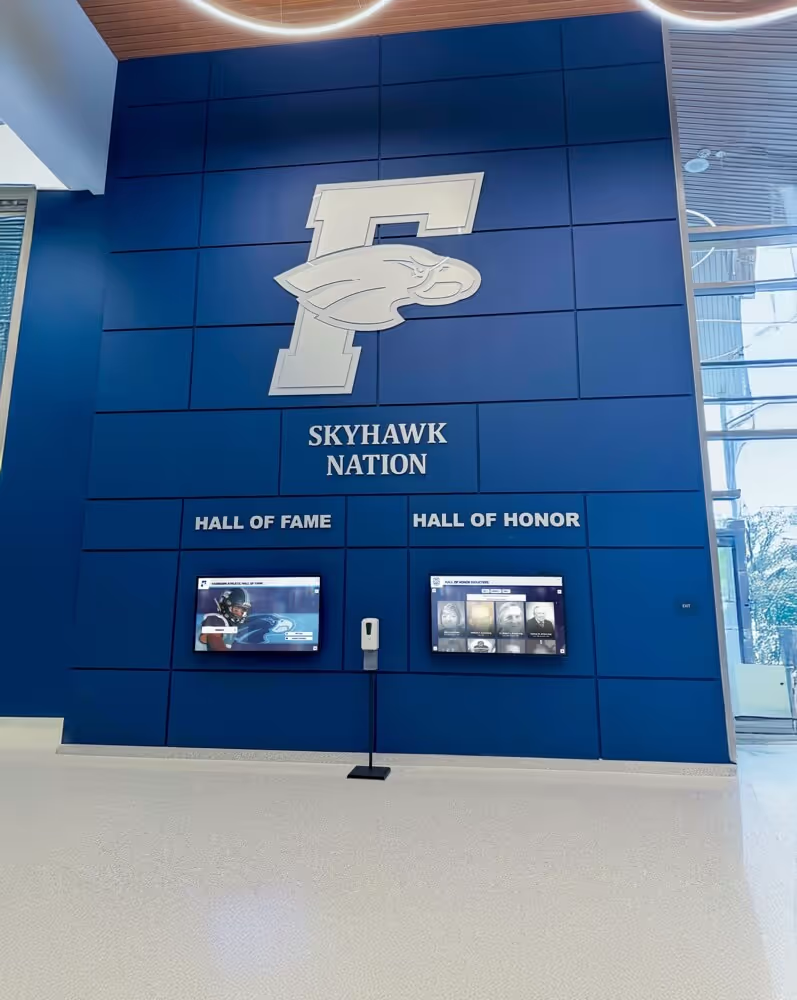
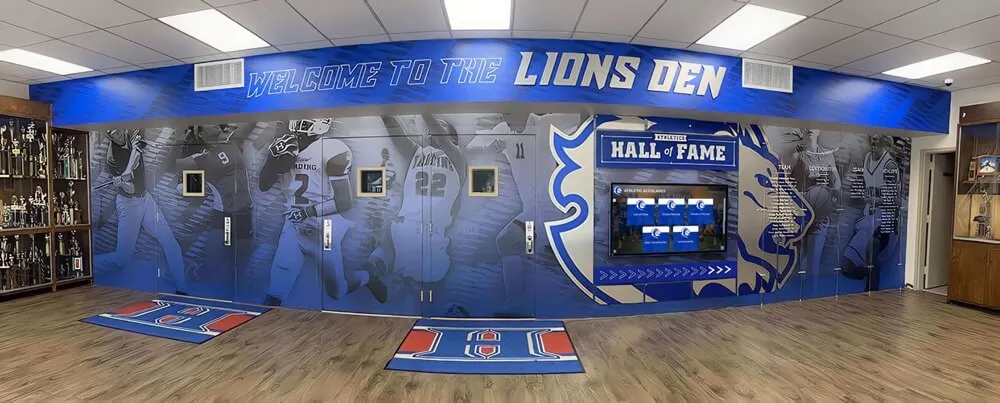
Athletic Facilities and Stadium Entrances: Many prospects prioritize campus recreation and athletic culture. Interactive displays at gyms, stadiums, or athletic complexes tell sports history stories, recognize championship achievements, showcase student-athlete academic success, and communicate athletic culture importance. These installations particularly impact athletic recruit visits and students valuing comprehensive college experiences.
Residential Life Areas and Campus Dining Facilities: Displays in or near residence halls and dining spaces tell student life stories through testimonials, organization showcases, tradition documentation, and social programming highlights. These installations help prospects envision themselves living on campus—critical for residential enrollment decisions.
Tier 3 - Comprehensive Coverage (Implement Third):
Library and Academic Support Centers: Storytelling displays highlighting academic resources, tutoring services, research opportunities, and study abroad programs position institutions as student success-focused environments. These targeted messages particularly resonate with academically-oriented prospects and parents concerned about support infrastructure.
Outdoor Tour Stop Waypoints: Weatherproof displays at significant outdoor locations—memorial gardens, historic sites, scenic overlooks, or outdoor gathering spaces—extend storytelling throughout walking routes. Outdoor installations require higher investment but position content exactly where tour groups pause naturally.
Phased implementation following this prioritization manages initial investment while building internal support based on demonstrated recruitment impact before expanding comprehensively across campus.
Resources on strategic interactive display placement demonstrate positioning optimization for diverse campus environments and audience needs.
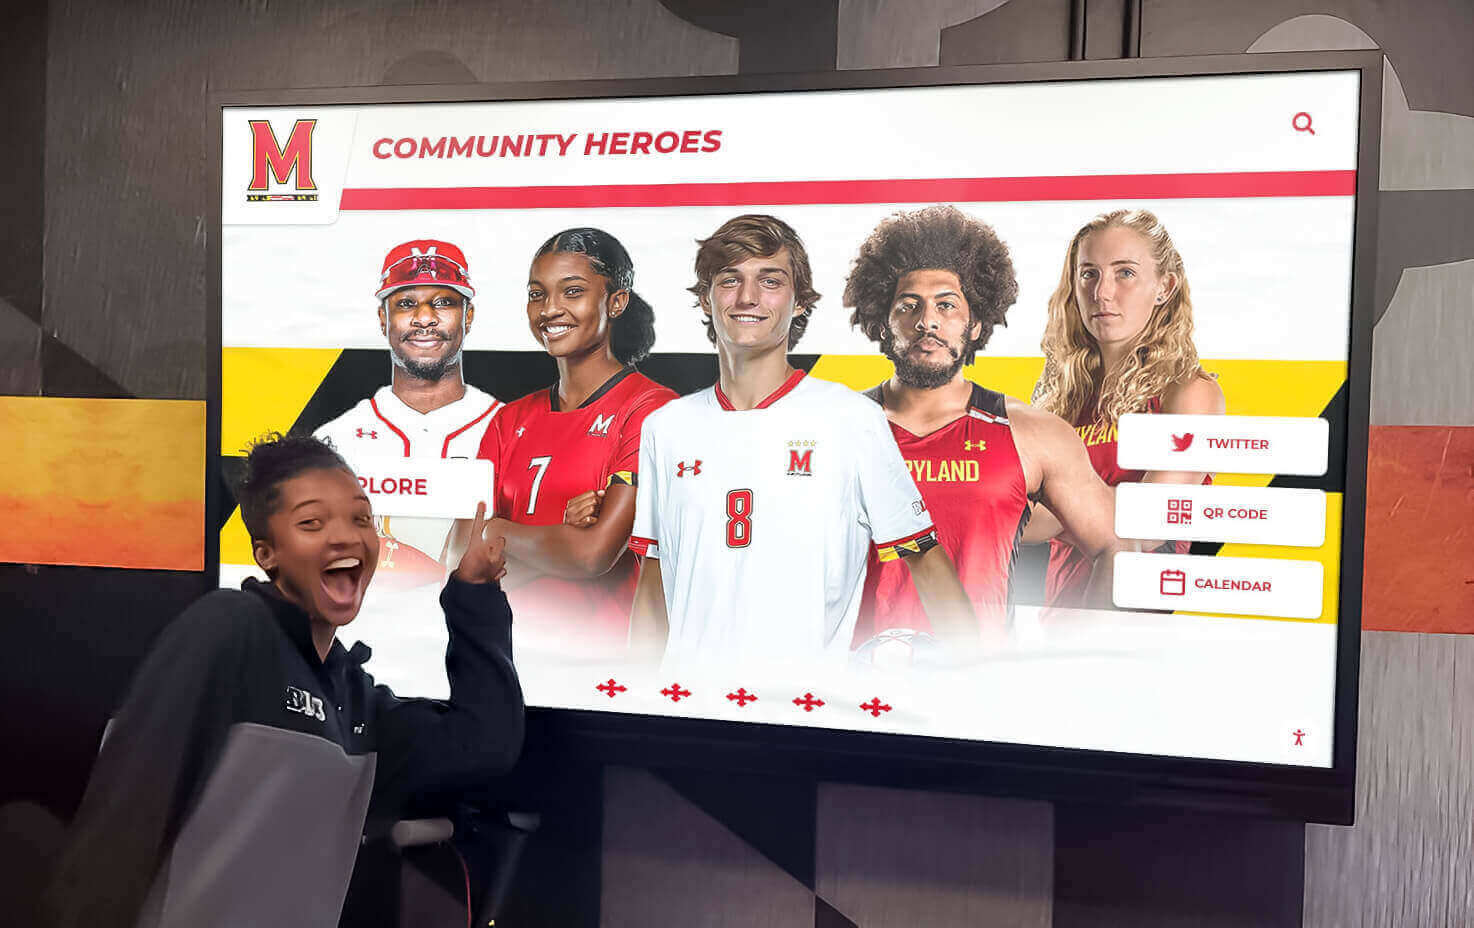
Content Strategy and Storytelling Development
Technology infrastructure enables storytelling, but compelling narrative content determines whether interactive displays actually engage prospective students or become ignored decorations.
Story Architecture and Narrative Design Principles
Effective interactive storytelling follows proven principles that capture attention and create emotional connections:
Start with Hero Stories Rather Than Institutional History: Prospective students connect emotionally with individual success narratives before caring about abstract institutional accomplishments. Lead with compelling alumni success stories, transformative student experiences, innovative faculty research, or impactful community partnerships—then connect these specific narratives to broader institutional strengths. A single medical school graduate who developed breakthrough cancer treatments resonates more powerfully than statistics about research funding levels.
Build Multi-Layered Narratives with Depth Options: Different visitors seek different information depths based on existing interest levels and time availability. Design storytelling content in layers:
- Summary level: 30-60 second overview with key highlights, compelling visuals, and emotional hooks
- Intermediate level: 2-3 minute deeper dive providing context, additional details, and specific examples
- Detailed level: 5-10+ minute comprehensive exploration with extensive multimedia, detailed data, and thorough documentation
This progressive disclosure accommodates both casual browsers and deeply-engaged prospects without overwhelming disinterested visitors or frustrating those seeking comprehensive information.
Incorporate Authentic Student Voices Throughout Content: Admissions marketing materials frequently feel scripted and artificial. Interactive storytelling provides opportunities for genuine student testimonials through:
- Unscripted video interviews with diverse students sharing honest experiences
- Student-authored written reflections about classes, research, clubs, or campus culture
- Photo essays with student captions showing daily campus life authentically
- “Day in the life” multimedia narratives following students through typical experiences
Authenticity matters more than polish—slightly imperfect student-created content often resonates more powerfully than professionally-produced institutional marketing videos.
Connect Physical Spaces to Stories: Interactive displays positioned at specific campus locations should tell stories relevant to those places:
- Athletic facility displays: championship histories, athlete academic achievements, coaching legacies
- Academic building displays: program innovations, faculty research, student projects, alumni career outcomes
- Campus center displays: student organization impacts, tradition origins, community service initiatives
- Historical landmark displays: founding stories, architectural significance, notable events at locations
Location-specific storytelling helps visitors understand how physical spaces connect to institutional missions and values—transforming architectural tours into educational experiences.
Approaches demonstrated in educational storytelling implementations show effective narrative strategies for institutional contexts.
Multimedia Content Development and Production
Professional-quality multimedia assets elevate storytelling impact beyond text-based content alone:
Video Testimonial Production: Student and alumni video testimonials form powerful storytelling foundations. Production best practices include:
- 2-5 minute duration for featured testimonials (longer versions available for deeper exploration)
- Natural outdoor or meaningful indoor campus locations as backdrops
- Conversational interviews rather than scripted presentations
- Honest discussion of challenges overcome alongside successes achieved
- High-quality audio (invest in external microphones even with basic cameras)
- Professional editing for pacing but maintaining authentic feel
- Closed captions for accessibility and sound-off viewing
Budget 1-2 days production time per 10-15 finished testimonials including interviews, B-roll campus footage capture, and editing. Consider hiring student filmmakers providing authentic perspectives while developing portfolio work.
Historical Photo and Document Digitization: Archival materials connecting contemporary experiences to institutional heritage require careful digitization:
- High-resolution scanning (600+ DPI for photos, 300 DPI for documents)
- Color correction and exposure adjustment for faded materials
- Metadata documentation (dates, people, events, locations) enabling searchability
- Copyright clearance for non-institutional materials
- Organized digital asset management enabling easy content incorporation
Partner with institutional archives or libraries possessing scanning equipment and archival expertise rather than duplicating infrastructure.
Photography Standards for Contemporary Content: Current campus life documentation requires consistent professional quality:
- Diverse student representation reflecting actual institutional demographics
- Authentic moments rather than obviously staged scenarios
- Release forms from recognizable individuals for legal protection
- Seasonal variation showing campus across academic year
- Multiple aspect ratios (16:9, 4:3, 1:1, 9:16) supporting various display orientations and layouts
- Night and day photography capturing campus atmosphere comprehensively
Establish regular photography schedule (weekly or biweekly) building comprehensive image libraries over time rather than single intensive photo shoots missing temporal variety.
Data Visualization and Infographic Design: Statistics and outcomes data require visual presentation for quick comprehension:
- Clean, uncluttered designs emphasizing key statistics
- Institutional brand colors and typography maintaining consistency
- Animated data reveals for interactive engagement
- Comparison frameworks (versus peers, national averages, historical trends)
- Sourcing and date attribution ensuring credibility
- Regular updates maintaining current relevance
Solutions like Rocket Alumni Solutions provide purpose-built platforms for educational institutions, offering intuitive content management tools specifically designed for campus storytelling with professional templates, multimedia support, and proven reliability serving admissions programs nationwide.
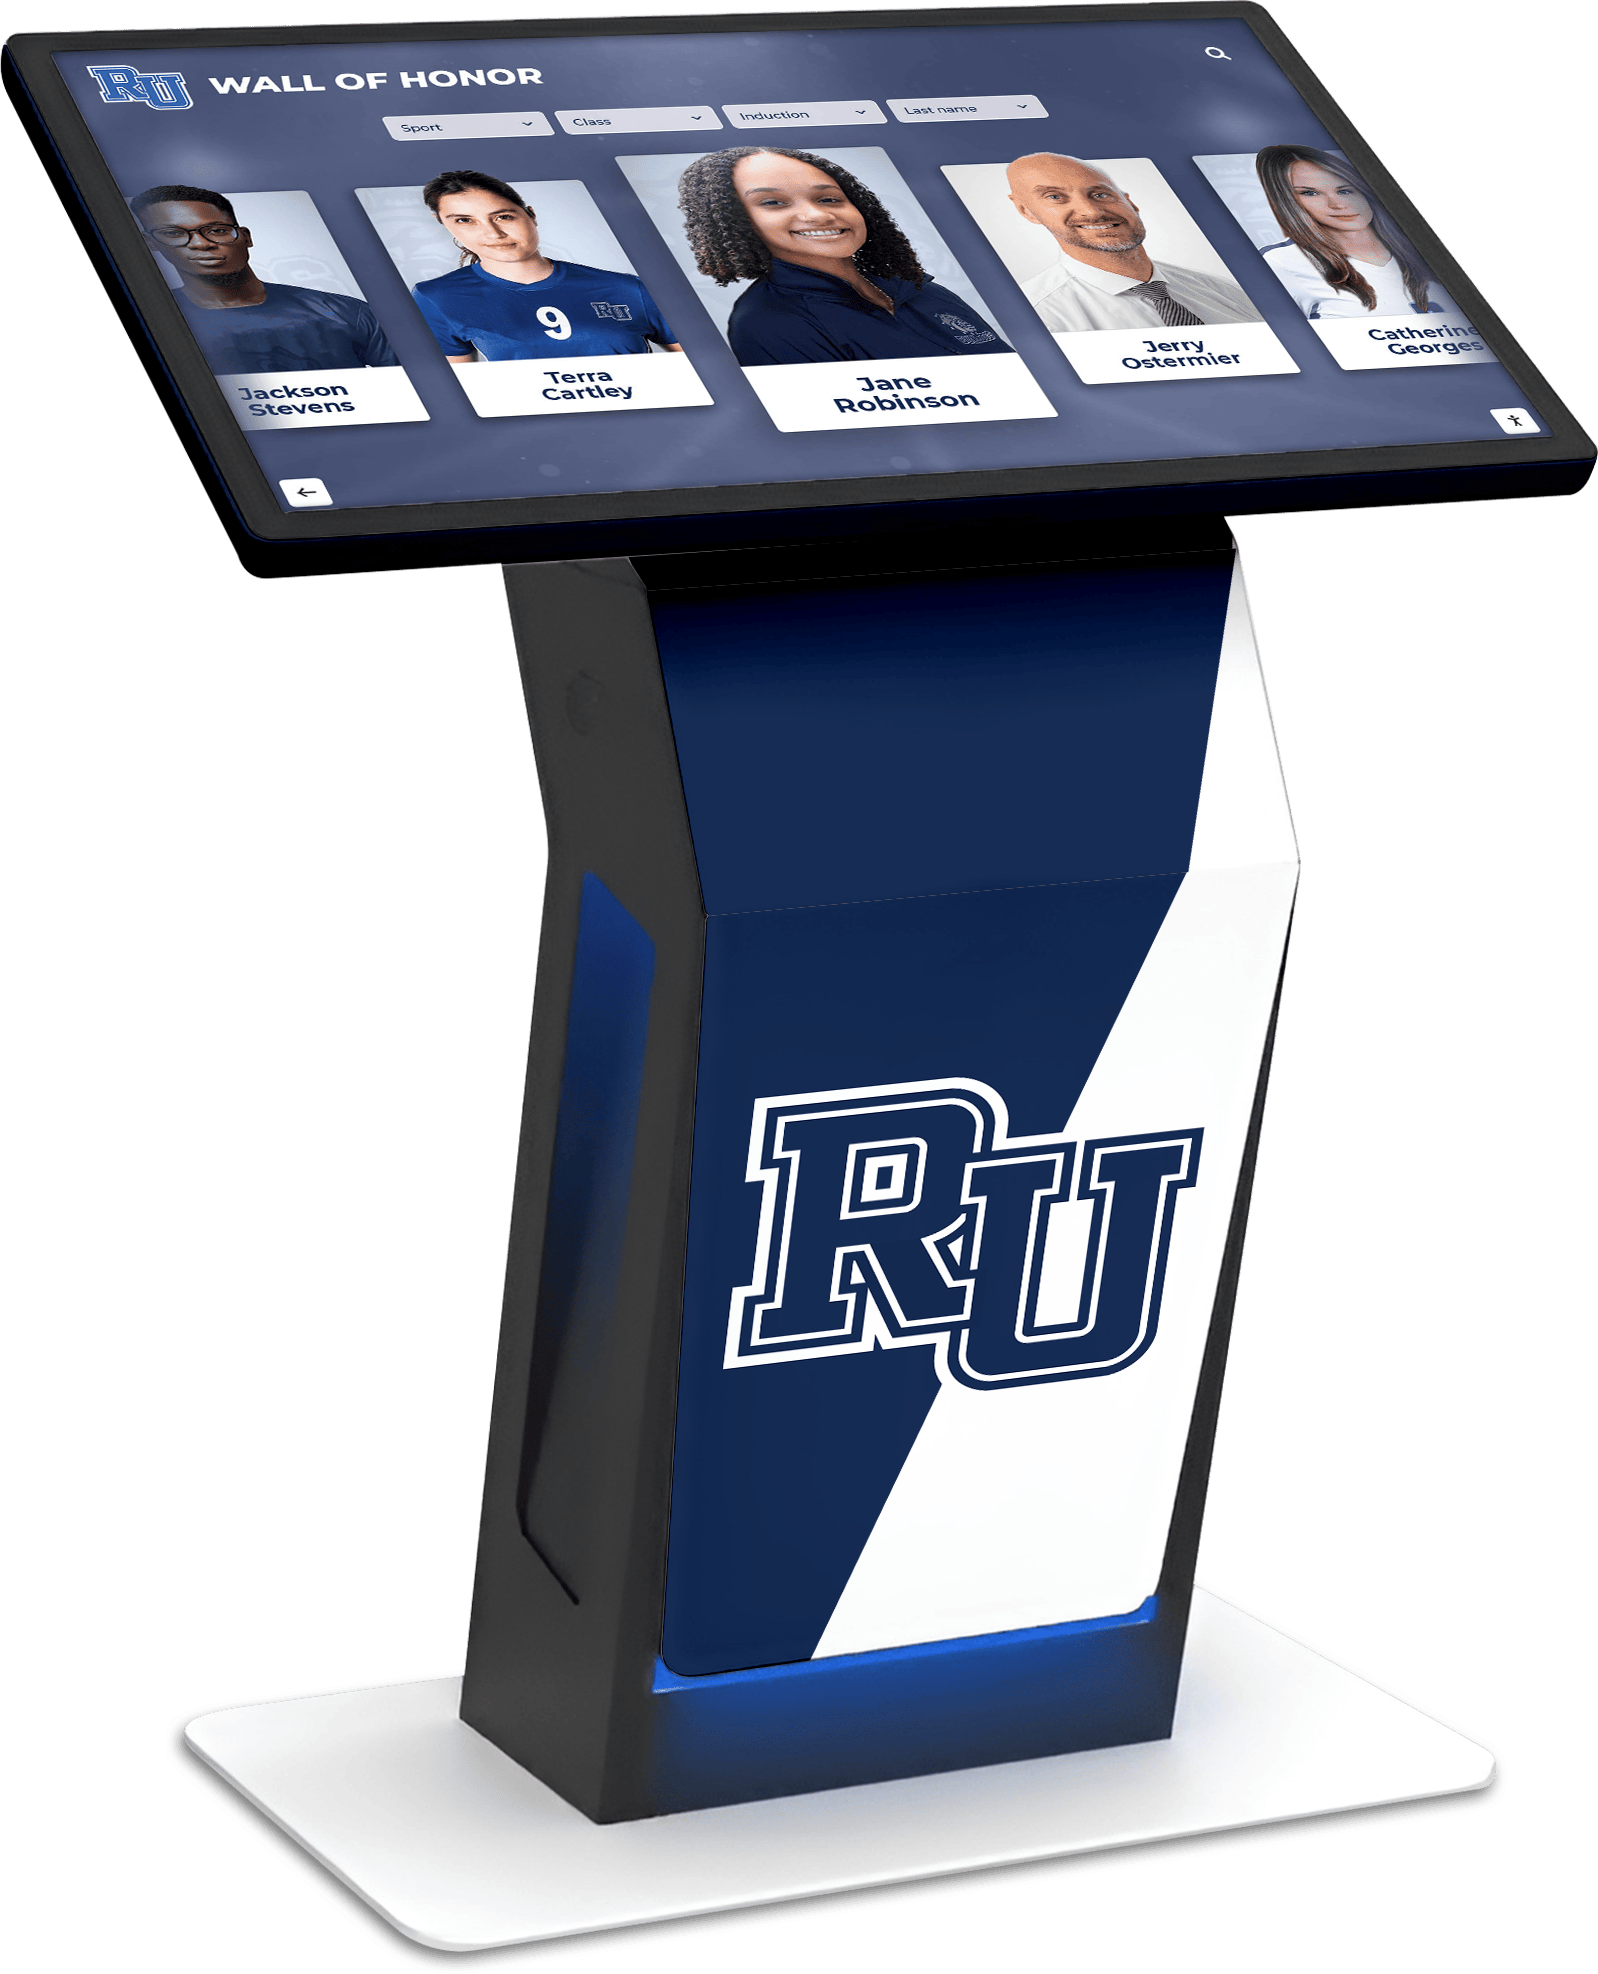
Seasonal Content Updates and Admissions Cycle Alignment
Interactive storytelling remains fresh and relevant through strategic content updates aligned with enrollment calendars:
Fall Semester Focus (September-November): Emphasize content supporting early decision/action applicants and regular decision research:
- New student transition success stories showing first-year experiences
- Updated employment and graduate school placement statistics from recent graduates
- Autumn campus atmosphere and traditions documentation
- Academic program highlights for application season decision-making
- Application deadline reminders and admissions event promotion
Spring Semester Focus (January-April): Prioritize content supporting admitted student yield and enrollment decisions:
- Admitted student welcome messaging and yield event promotion
- Financial aid and scholarship information transparency
- Housing selection and orientation program details
- Transfer student transition success narratives
- Deposit deadline awareness without aggressive sales pressure
Summer Focus (May-August): Support summer tour programs and incoming student preparation:
- Incoming class profiles creating excitement about future classmates
- Campus improvement updates showcasing institutional investment
- Summer program highlights for pre-college students
- Student organization previews for fall involvement planning
- Move-in logistics and first-year preparation guidance
Year-Round Evergreen Content: Maintain core storytelling unaffected by seasonal changes:
- Institutional history and heritage narratives
- Mission, values, and educational philosophy explanations
- Notable alumni achievement profiles
- Research breakthroughs and faculty innovation stories
- Diversity, equity, and inclusion commitment demonstrations
Schedule quarterly content review meetings assessing engagement analytics, identifying refresh needs, planning production for upcoming seasonal priorities, and archiving outdated content maintaining display relevance.
Budget Development and ROI Calculation
Comprehensive budget understanding enables realistic proposals, appropriate funding requests, and accurate timeline planning for interactive storytelling implementations.
First-Year Implementation Costs
Hardware Components (per installation location):
- Commercial touchscreen display (43-55"): $2,500-$5,000
- Commercial touchscreen display (65-75"): $4,500-$9,000
- Computing hardware/media player: $800-$2,000
- Freestanding kiosk enclosure: $3,000-$6,000
- Wall-mount system with professional installation: $1,500-$3,000
- Outdoor-rated weatherproof enclosure: $6,000-$12,000
Infrastructure Installation (per location):
- Network cable installation (if required): $500-$2,000
- Electrical outlet installation (if required): $400-$1,200
- Professional mounting and integration: $1,000-$2,500
- Cable management and finishing: $200-$800
- Permitting and approvals (if required): $100-$500
Software and Content (typically campus-wide, not per-display):
- Software platform licensing (annual subscription): $3,000-$10,000
- Initial content development and production: $10,000-$30,000
- Content management training: $1,000-$3,000
- Template customization and branding: $2,000-$5,000
Typical Single-Location Total: $15,000-$35,000 first year depending on display size, enclosure type, infrastructure needs, and content production scope.
Typical Three-Location Campus Deployment: $35,000-$80,000 first year (infrastructure costs lower for subsequent locations; software and base content costs campus-wide rather than per-display).
Ongoing Annual Operating Costs
Software and Platform Services (campus-wide):
- Software licensing and platform fees: $3,000-$10,000 annually
- Technical support and maintenance agreements: $1,500-$4,000 annually
- Cloud hosting and content delivery: Often included in platform fees
Content Maintenance and Updates:
- Ongoing content production (video, photography): $5,000-$15,000 annually
- Staff time for content management (2-5 hours weekly): $3,000-$8,000 annually
- Seasonal content refresh projects: $2,000-$6,000 annually
Hardware Maintenance:
- Cleaning, calibration, and minor repairs: $300-$600 per display annually
- Warranty extension or service agreements: $200-$500 per display annually
Typical Annual Operating Costs: $12,000-$35,000 campus-wide depending on installation scale, content production frequency, and staffing models.
Return on Investment Calculation Framework
Interactive storytelling systems deliver value through multiple channels justifying initial and ongoing investments:
Enrollment Yield Improvement: Calculate impact of technology-enhanced tours on admitted student matriculation:
- Baseline yield rate (percent of admitted students who enroll)
- Estimated yield improvement from enhanced tour experiences (conservative 1-3% realistic based on higher education enrollment research)
- Tuition revenue per enrolled student
- Additional students enrolled attributable to improved yield
- Net revenue increase versus technology investment
Example: Institution with 40% baseline yield, 2,000 annual admits, $50,000 annual tuition. Improving yield by 2 percentage points (40% to 42%) enrolls 40 additional students generating $2,000,000 additional annual revenue. Technology investment of $100,000 pays for itself in 2-3 weeks of the enrollment cycle while delivering value over 7-10 year hardware lifecycles.
Admissions Staff Efficiency Gains: Tour guides spend less time memorizing and reciting detailed institutional information when interactive displays handle complex storytelling:
- Current staff time per tour delivering complex content
- Time savings per tour with technology assistance (realistic 10-20%)
- Annual tour volume
- Loaded hourly rate for tour guide staff
- Annual staff time cost savings
Most institutions conducting 500+ annual campus tours realize $8,000-$15,000 annual staff efficiency value from technology supporting rather than replacing human tour guides.
Marketing and Recruitment Cost Optimization: Interactive displays reduce printed viewbook costs, supplement rather than replace expensive travel-based recruitment, and extend limited admissions staff reach:
- Reduced printing costs for materials displays digitally present
- Virtual tour enhancement reducing need for some travel-based recruitment
- Extended recruitment reach to prospects who cannot visit physically through content available online
- Marketing material production efficiency (digital updates versus print runs)
Competitive Positioning Value: While difficult to quantify precisely, technology-enhanced tour experiences influence institutional reputation, word-of-mouth recommendations, and competitive standing among peer institutions:
- Improved tour satisfaction scores and visitor feedback
- Social media mentions and online reviews highlighting technology
- Consultant and counselor perceptions of institutional innovation
- Peer institution technology adoption trends
Examples of institutional recognition system implementations demonstrate ROI calculation approaches and realized value across educational environments.
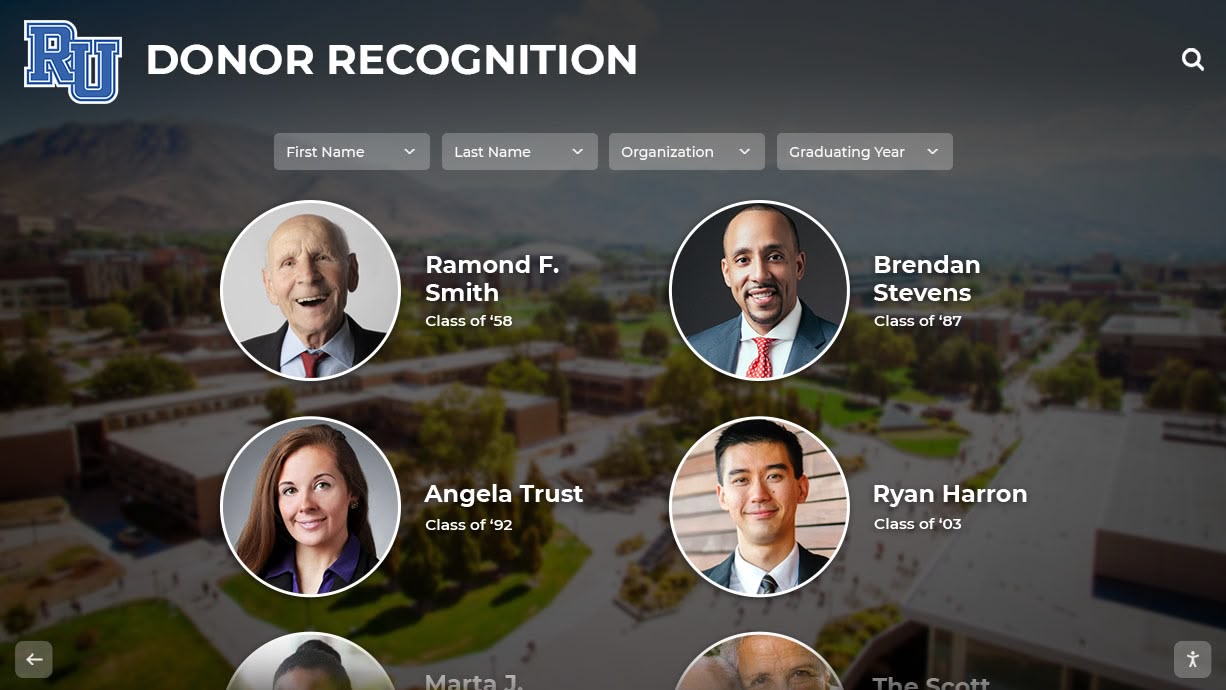
Installation Process and Implementation Timeline
Systematic project management ensures successful implementation meeting deadlines, budgets, and quality expectations.
Phase 1: Planning and Design (6-8 Weeks)
Weeks 1-2: Stakeholder alignment and requirements definition
- Cross-functional team formation and kickoff meeting
- Tour program analysis and pain point documentation
- Content inventory and gap identification
- Success metrics definition and measurement planning
Weeks 3-4: Vendor research and platform evaluation
- Software platform demonstrations and feature assessment
- Hardware specification and supplier research
- Reference checks with peer institutions
- Budget development and financial approval process
Weeks 5-6: Detailed site surveys and technical planning
- Physical space assessment at each installation location
- Infrastructure evaluation (power, network, mounting)
- ADA compliance verification
- IT security review and approval process initiation
Weeks 7-8: Contract finalization and project planning
- Vendor selection and contract negotiation
- Detailed project timeline development
- Content production planning and resource allocation
- Implementation team assignments and responsibilities
Deliverables: Signed contracts, approved budget, detailed implementation plan, content development roadmap, and stakeholder communication plan.
Phase 2: Content Development and Infrastructure Preparation (8-12 Weeks)
Weeks 1-4: Multimedia content production
- Student and alumni testimonial video production
- Campus photography sessions and image curation
- Historical material digitization and organization
- Data visualization and infographic design
Weeks 5-8: Interactive content authoring and testing
- Story structure design and navigation planning
- Content population in management platform
- Multimedia integration and functionality testing
- Internal review and approval workflows
Weeks 9-12: Infrastructure installation
- Network cable installation (if required)
- Electrical outlet installation (if required)
- Mounting hardware preparation and installation
- IT network configuration and security approval
Deliverables: Complete multimedia content library, fully-populated interactive storytelling applications ready for deployment, and prepared installation sites with infrastructure ready for hardware.
Phase 3: Hardware Installation and System Integration (3-4 Weeks)
Week 1: Hardware delivery and installation
- Equipment receiving and inspection
- Display mounting and enclosure installation
- Computing hardware installation and connection
- Cable management and finishing
Week 2: Software configuration and content deployment
- Software installation and licensing activation
- Content synchronization to local displays
- Network connectivity verification
- Security configuration and testing
Week 3: System testing and quality assurance
- Complete functionality verification across all interactive features
- Content display quality assessment
- Touch responsiveness and navigation testing
- Audio/video playback verification
- Accessibility feature validation
Week 4: Staff training and soft launch
- Tour guide training and demonstration
- Admissions staff platform administration training
- Documentation delivery (user guides, troubleshooting procedures)
- Soft launch for internal testing and feedback
Deliverables: Fully operational interactive storytelling displays passing all acceptance criteria, trained staff, complete documentation, and readiness for public launch.
Phase 4: Launch and Optimization (2-3 Weeks)
Week 1: Public launch and communications
- Campus communications announcing new tour enhancements
- Tour guide integration of displays into standard routes
- Visitor feedback collection mechanisms implementation
- Analytics monitoring activation
Week 2: Issue resolution and refinement
- User feedback processing and prioritization
- Minor content adjustments based on initial observations
- Technical issue resolution and system optimization
- Staff additional training addressing questions
Week 3: Success measurement and reporting
- Initial analytics review and engagement analysis
- Stakeholder results reporting
- Continuous improvement planning
- Maintenance procedures establishment
Deliverables: Successfully launched public-facing interactive storytelling system, established maintenance workflows, baseline success metrics, and continuous improvement roadmap.
Total Project Timeline
Minimum Implementation: 19-27 weeks from project initiation to public launch Typical Implementation: 22-30 weeks allowing buffer for content production iterations, approvals, and infrastructure complications Complex Multi-Location Deployments: 28-36 weeks for comprehensive implementations across large institutions with extensive content requirements
Plan project timelines avoiding peak admissions periods (late fall application season, spring admitted student yield period) when staff availability limited and focus appropriately directed toward core recruitment activities.
Comprehensive implementation strategies for campus technology projects provide detailed project management frameworks and timeline optimization approaches.
Content Management and Long-Term Sustainability
Sustained storytelling value requires establishing clear governance, efficient update workflows, and quality assurance processes from implementation start.
Assigning Content Responsibility and Governance
Centralized Coordinator Model: Designate single staff member (typically within admissions, communications, or marketing) overseeing:
- Overall content strategy and narrative consistency
- Quality standards enforcement
- Content request intake from departments
- Production vendor coordination
- Analytics monitoring and reporting
- Platform administration and user management
Advantages: Consistent messaging, professional quality control, clear accountability. Disadvantages: Potential bottleneck, single person dependency, workload concentration.
Distributed Responsibility Model: Empower multiple departments to manage relevant content areas:
- Admissions: Tour-specific content, admitted student messaging, general enrollment information
- Academic affairs: Program-specific content, faculty profiles, curriculum highlights
- Student affairs: Student life content, organization profiles, campus culture narratives
- Advancement: Alumni success stories, donor impact narratives, historical materials
- Athletics: Sports history, student-athlete achievements, facility showcases
Advantages: Distributed workload, subject matter expertise, faster updates. Disadvantages: Potential inconsistency, coordination complexity, quality variation.
Hybrid Model (Recommended): Central coordinator maintains overall governance, platform administration, quality standards, and strategic direction while granting specific content area permissions to appropriate departments within established templates and guidelines. Balances efficiency benefits of distribution with consistency advantages of centralization.
Efficient Content Update Workflows
Semester Transition Updates: Schedule major content refreshes aligned with academic transitions:
- Pre-semester review of all content for currency and relevance
- Archiving or updating outdated information
- Incorporating new student testimonials and recent graduate success stories
- Refreshing photography showing seasonal campus atmosphere
- Adding new program information and curricular innovations
Block 20-30 hours for comprehensive semester updates depending on content volume and change scope.
Event-Driven Updates: Establish rapid update processes for timely content:
- Admissions event promotion (open houses, admitted student days)
- Campus achievement announcements (championships, awards, rankings)
- Facility improvements and campus development progress
- Newsworthy institutional milestones deserving immediate recognition
Maintain update capability within 24-48 hours for time-sensitive content maintaining display relevance and freshness.
Continuous Improvement Updates: Implement regular content optimization based on engagement analytics:
- Monthly analytics review identifying low-engagement content requiring revision
- A/B testing different content approaches measuring effectiveness
- User feedback incorporation addressing reported issues or suggestions
- Accessibility improvements ensuring inclusive experiences
Quality Assurance and Review Procedures: Establish approval workflows preventing errors from reaching public displays:
- Peer review for factual accuracy before publishing
- Style and branding consistency checking
- Multimedia quality verification (resolution, audio levels, load times)
- Cross-device testing ensuring consistent display across hardware
- Accessibility validation for screen readers and keyboard navigation
Examples of successful campus content management strategies demonstrate sustainable governance approaches maintaining quality over multi-year deployments.
Measuring Success and Demonstrating Value
Quantifying interactive storytelling impact helps justify investments, optimize implementations, and demonstrate recruitment value to institutional leadership.
Engagement Analytics and Usage Metrics
Interaction Volume and Patterns: Track usage revealing actual engagement levels:
- Daily/weekly/monthly unique visitors interacting with displays
- Average session duration per visitor
- Peak usage times correlating with tour schedules
- Content sections receiving most engagement
- Interaction depth (how many story layers visitors explore)
- Geographic and demographic patterns (when available through registration data)
Content Performance Analysis: Identify which stories resonate most powerfully:
- Most-viewed individual stories and testimonials
- Video completion rates showing compelling versus abandoned content
- Navigation patterns revealing intuitive versus confusing structures
- Search query analysis (if applicable) revealing visitor interests
- Time-on-content metrics identifying engaging narratives
- Share and bookmark rates indicating memorable content
Tour Program Integration Metrics: Assess how displays enhance guided tour experiences:
- Correlation between display engagement and tour attendance
- Guide usage patterns and control interactions
- Group size relationship to engagement depth
- Seasonal variation in usage aligned with admissions cycles
Admissions Outcome Correlations
Yield Rate Impact Assessment: Compare matriculation rates for prospects engaging versus not engaging with interactive storytelling:
- Baseline yield among prospects visiting campus before implementation
- Post-implementation yield among campus visitors
- Yield differential between visitors engaging with displays versus those who don’t (requires visitor registration or tracking)
- Longitudinal trends over multiple admissions cycles
Application Behavior Analysis: Examine whether enhanced tour experiences influence application patterns:
- Application rates among campus visitors pre- versus post-implementation
- Application quality metrics (GPA, test scores) for visitors experiencing technology-enhanced tours
- Early decision/action application rates among campus visitors
- Demonstrated interest scoring adjustments for display engagement
Visitor Satisfaction and Experience Metrics: Gather qualitative feedback supplementing quantitative analytics:
- Post-visit survey inclusion of technology experience questions
- Net Promoter Score changes attributable to tour enhancements
- Online review and social media sentiment analysis
- Tour guide feedback on visitor reactions and engagement
- Comparative positioning versus peer institution tour experiences
Financial Return Calculation
Direct Revenue Impact: Calculate enrollment revenue attributable to enhanced recruitment:
- Additional enrolled students from yield improvement × annual tuition
- Multi-year value accounting for retention through graduation
- Net present value of incremental enrollment over time
- Comparison with technology investment and operating costs
Cost Avoidance and Efficiency Gains: Quantify operational savings:
- Reduced print material costs for information digitally delivered
- Staff time savings from technology-assisted storytelling
- Marketing production efficiency improvements
- Extended recruitment reach reducing travel costs
Competitive Positioning Value: Assess harder-to-quantify strategic benefits:
- Improved institutional reputation and brand perception
- Enhanced counselor and consultant recommendations
- Positive word-of-mouth from impressed campus visitors
- Recruitment advantages over less technologically sophisticated peers
Most institutions conducting 500+ annual campus tours with 1,000+ prospective student visitors realize measurable ROI within 2-3 enrollment cycles while hardware delivers value over 7-10 year lifespans. Conservative yield improvement of just 1-2 percentage points typically generates tuition revenue exceeding total technology investment within single academic years.
Frameworks demonstrated in educational technology ROI analysis provide detailed calculation methodologies and success measurement approaches.
Common Implementation Challenges and Solutions
Understanding typical obstacles institutions encounter helps prevent problems limiting interactive storytelling effectiveness or causing unnecessary implementation delays.
Challenge: “Content Development Overwhelms Our Resources”
Many institutions underestimate time and expertise required for professional multimedia storytelling content production, leading to implementation delays or launching with inadequate content undermining system value.
Solution Strategies:
Start with Existing Materials: Audit current admissions marketing assets—viewbooks, website content, social media posts, recruitment videos—repurposing quality existing content before producing everything from scratch. Most institutions already possess 40-60% of needed content requiring only reformatting for interactive presentation.
Phased Content Development: Launch initial displays with “minimum viable storytelling”—core institutional narrative with essential program highlights—then expand content depth iteratively over subsequent semesters. Better to launch with solid foundation content that grows than delay indefinitely pursuing comprehensive perfection.
Student Production Partnerships: Engage student filmmakers, photographers, writers, and designers through coursework, work-study positions, or paid freelance projects. Students often produce authentic, compelling content at lower costs than professional agencies while developing portfolio work and gaining real-world experience.
Professional Production Investments: Budget for professional video production, photography, and design services for cornerstone content requiring highest quality. Strategic investment in 5-10 professional testimonial videos, comprehensive campus photography, and polished data visualizations elevates overall presentation quality while student-produced content fills supplementary roles.
Template-Based Authoring: Utilize platform design templates reducing need for custom design work. Professional templates enable non-designer staff to create quality content quickly by simply populating text, images, and videos into proven layouts.
Challenge: “Tour Guides Feel Threatened by Technology”
Current student tour guides sometimes worry interactive displays will replace human guides or undermine their importance, creating resistance that limits technology effectiveness.
Solution Strategies:
Early Guide Engagement: Involve student guides in planning from project start—soliciting input about tour challenges, gathering feedback on content priorities, and incorporating suggestions into implementations. Participation creates ownership rather than feeling imposed upon by administrators.
Emphasize Human-Technology Partnership: Frame interactive displays as guide support tools rather than replacements. Displays handle complex information delivery (statistics, historical details, visual storytelling) freeing guides to focus on relationship building, answering questions, and sharing personal experiences technology cannot replicate.
Guide Control Features: Implement remote control capabilities enabling guides to operate displays from smartphones—selecting relevant content, advancing stories, and controlling presentations. This positions guides as technology operators rather than technology subjects, maintaining their centrality to tour experiences.
Testimonial Content Featuring Guides: Include current student guides in testimonial content—sharing why they chose institutions, discussing campus involvement, and explaining guide motivations. This recognition validates guide importance while leveraging their authentic voices.
Challenge: “Measuring ROI Proves Difficult”
Isolating interactive storytelling impact on enrollment outcomes from numerous other recruitment variables creates attribution challenges complicating ROI demonstration.
Solution Strategies:
Establish Clear Baseline Metrics: Document comprehensive pre-implementation benchmarks including historical yield rates, application volumes, tour attendance, and visitor satisfaction scores. Clear baselines enable post-implementation comparison revealing trends potentially attributable to technology enhancements.
Visitor Tracking and Correlation: Implement systems correlating individual visitor engagement with subsequent enrollment behaviors—linking display interaction data with CRM prospect records, tracking which enrolled students engaged with displays during campus visits, and analyzing engagement depth relationship to application timing and quality.
Comparison Group Analysis: When feasible, compare outcomes for prospects visiting campus with technology access versus those visiting peer institutions without interactive storytelling or attending virtual-only programs lacking physical display access. Comparative analysis helps isolate technology contribution from other recruitment factors.
Qualitative Feedback Collection: Gather visitor testimonials, guide observations, and staff feedback documenting perceived value even when quantitative metrics prove challenging. Compelling qualitative evidence supplements imperfect quantitative data providing holistic impact assessment.
Multi-Year Trend Analysis: Recognize ROI measurement requires longitudinal observation—single-year data rarely definitive but multi-year trends showing sustained improvement correlating with technology deployment provide stronger evidence of positive impact.
Challenge: “Keeping Content Fresh and Current”
Initial enthusiasm sometimes fades as staff face ongoing content maintenance responsibilities, leading to outdated information undermining display credibility and effectiveness.
Solution Strategies:
Scheduled Content Review Calendar: Establish non-negotiable quarterly content audits built into staff calendars with clear responsibilities, review checklists, and approval workflows. Routine scheduling prevents maintenance from becoming neglected afterthought.
Automated Content Expiration: Configure platform to flag or automatically hide content passing expiration dates—forcing proactive updates rather than allowing outdated information to persist indefinitely unnoticed.
Analytics-Driven Prioritization: Focus limited maintenance resources on highest-engagement content delivering most value. Content receiving minimal attention may not warrant frequent updates while popular stories deserve regular refresh maintaining currency.
Community Contribution Processes: Enable easy content submissions from students, faculty, alumni, and departments—creating lightweight intake forms and review workflows allowing distributed community to contribute stories reducing central staff production burden.
Evergreen Content Balance: Mix timely content requiring frequent updates with evergreen institutional stories remaining relevant indefinitely. Balanced content portfolios reduce maintenance intensity while maintaining freshness through strategic updates to timely content only.
Approaches demonstrated in institutional content sustainability strategies provide proven governance frameworks maintaining quality over extended deployments.
Accessibility Implementation Checklist
Ensuring inclusive storytelling access requires addressing both physical installation and digital interface accessibility throughout implementation.
Physical Accessibility Requirements
□ Display Positioning: Screen center 40-48 inches above finished floor accommodating both standing and seated wheelchair users within ADA forward reach range (15-48")
□ Clear Approach Space: Minimum 30" × 48" wheelchair approach zone with firm, stable, slip-resistant surface
□ Protruding Object Compliance: Wall-mounted displays above 27" project maximum 4"; below 27" detectable by cane sweep
□ Control Accessibility: All interactive controls (power, volume, display selection if applicable) within reach ranges and operable with single hand
□ Pathway Accessibility: Accessible route from building entrances, parking areas, and tour routes to display locations meeting slope requirements (maximum 1:12) and minimum 36" width
□ Visual Notification: Display location signage or wayfinding visible from accessible approaches preventing confusion about location
□ Emergency Accessibility: Emergency information display and evacuation routes accessible to all users regardless of ability
Digital Interface Accessibility
□ Screen Reader Compatibility: Proper semantic HTML structure, comprehensive image alternative text, logical reading order, ARIA labels for interactive elements
□ Keyboard Navigation: All functions operable via keyboard alone without mouse/touch requirement, visible focus indicators, logical tab order, documented keyboard shortcuts
□ Text and Visual Accessibility: Minimum 18pt body text (user-adjustable to 24pt+), 4.5:1 color contrast for normal text, 3:1 for large text and UI components, no information conveyed by color alone
□ Audio Accessibility: Closed captions for video content, text transcripts for audio narratives, adjustable or muted audio not requiring sound for comprehension
□ Time Limits: No time-dependent interactions requiring rapid response, adequate time for reading and interaction, easy session extension options
□ Touch Target Size: Minimum 44×44 pixel interactive elements with adequate spacing preventing accidental activation
□ Cognitive Accessibility: Clear, simple language at appropriate reading levels, consistent navigation patterns, obvious error messages with correction guidance
□ Motor Accessibility: Touch gestures have single-tap alternatives, no precise coordination or simultaneous actions required, ample time for physical interactions
Resources from accessibility-focused display implementations provide detailed compliance verification procedures and testing protocols.
Conclusion: Transform Admissions Through Strategic Interactive Storytelling
Campus admissions represents increasingly competitive environment where institutions must differentiate themselves through experiences that create emotional connections during brief prospective student interactions. Interactive storytelling displays position institutions as forward-thinking, student-centered communities invested in delivering exceptional visitor experiences reflecting overall educational quality.
The most effective implementations recognize technology enables storytelling but doesn’t automatically create compelling narratives. Success requires thoughtful content strategy prioritizing authentic stories over institutional marketing, strategic placement positioning displays where tour groups naturally engage, and sustainable governance maintaining freshness through ongoing content evolution.
For admissions teams struggling to differentiate institutional identities, create memorable campus visits, deliver consistent messaging across hundreds of tours, or demonstrate enrollment marketing ROI, interactive campus storytelling systems provide proven solutions delivering measurable recruitment value while respecting limited staff resources and budget constraints.
Modern prospective students arrive on campuses expecting technology-enhanced experiences reflecting learning environments they’ll encounter as enrolled students. Institutions implementing sophisticated interactive storytelling meet these expectations while communicating institutional commitment to innovation, student success, and continual improvement—qualities influencing enrollment decisions as powerfully as academic program quality or campus aesthetics.
This implementation guide has provided actionable specifications, content strategies, placement frameworks, budget calculations, and installation procedures enabling you to confidently deploy interactive storytelling systems transforming campus tours from informational walks into emotionally engaging experiences that drive enrollment outcomes. Whether implementing new systems, modernizing existing tour programs, or expanding interactive capabilities to additional campus locations, the planning frameworks and technical specifications detailed throughout this guide enable successful projects delivering sustained admissions value.
Ready to transform your campus tours with interactive storytelling? Talk to our team at Rocket Alumni Solutions for comprehensive platforms specifically designed for educational institutions with proven admissions storytelling capabilities, intuitive content management, and support understanding recruitment needs.