Beyond Installation: Proving the Value of Your Digital Recognition Investment
You've invested in a cutting-edge digital hall of fame that transforms how your institution honors achievements and engages visitors. The displays are installed, content is loaded, and people are interacting with your interactive alumni displays. But how do you know if it's truly working? More importantly, how do you demonstrate value to stakeholders and optimize performance over time?
The difference between a digital hall of fame that delivers exceptional value and one that becomes expensive wallpaper often comes down to measurement. Without proper analytics and clear KPIs, you’re flying blind—unable to prove ROI, identify issues, or make data-driven improvements.
At Rocket Alumni Solutions, we’ve helped hundreds of institutions not just implement touchscreen halls of fame, but measure and maximize their impact through comprehensive analytics strategies. This guide reveals the metrics that matter most and how to use them to continuously improve your digital recognition program.
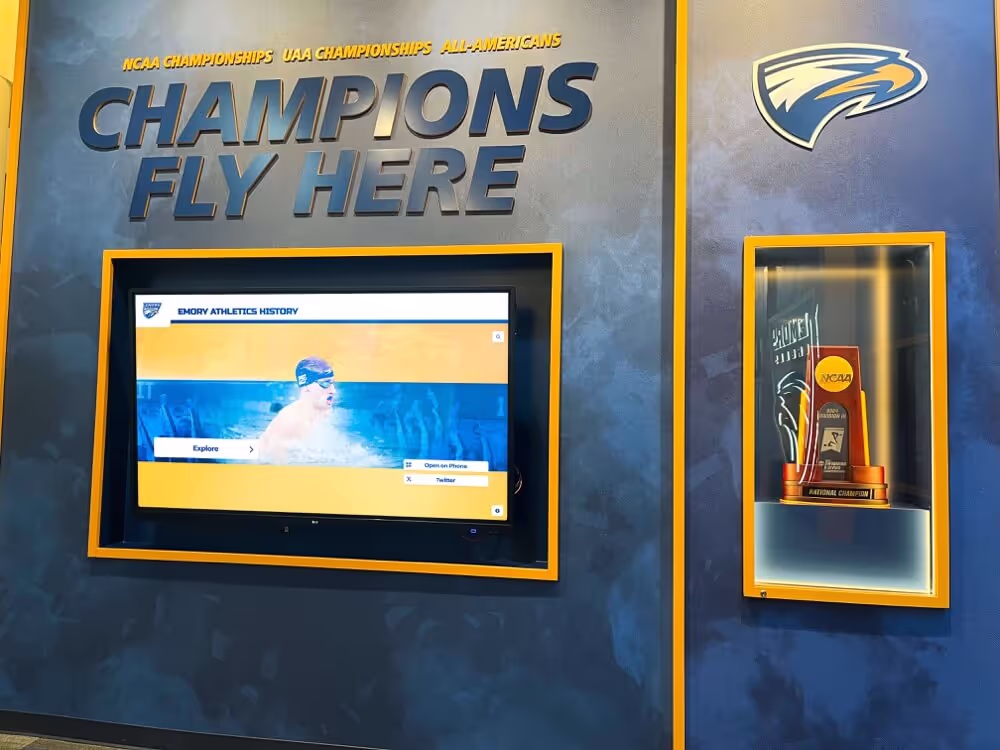
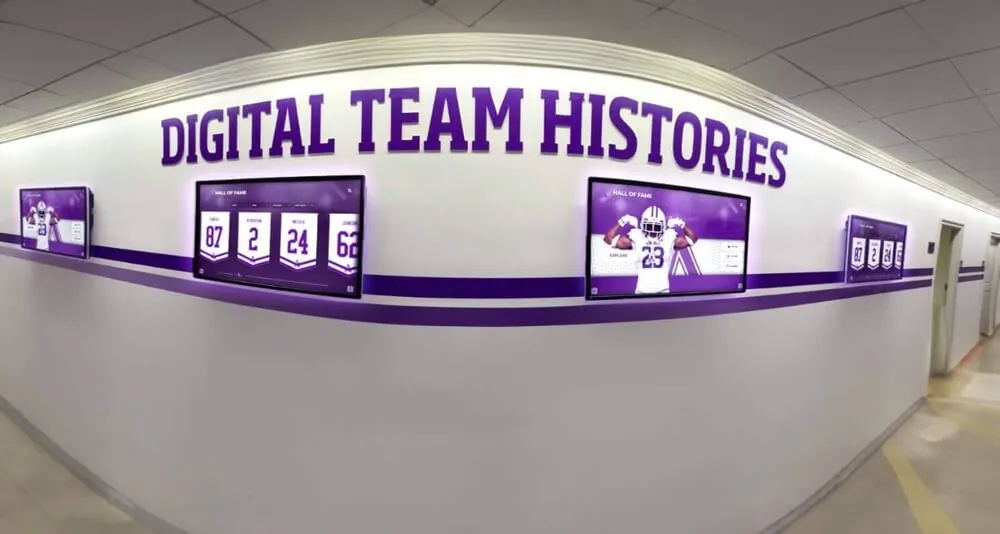
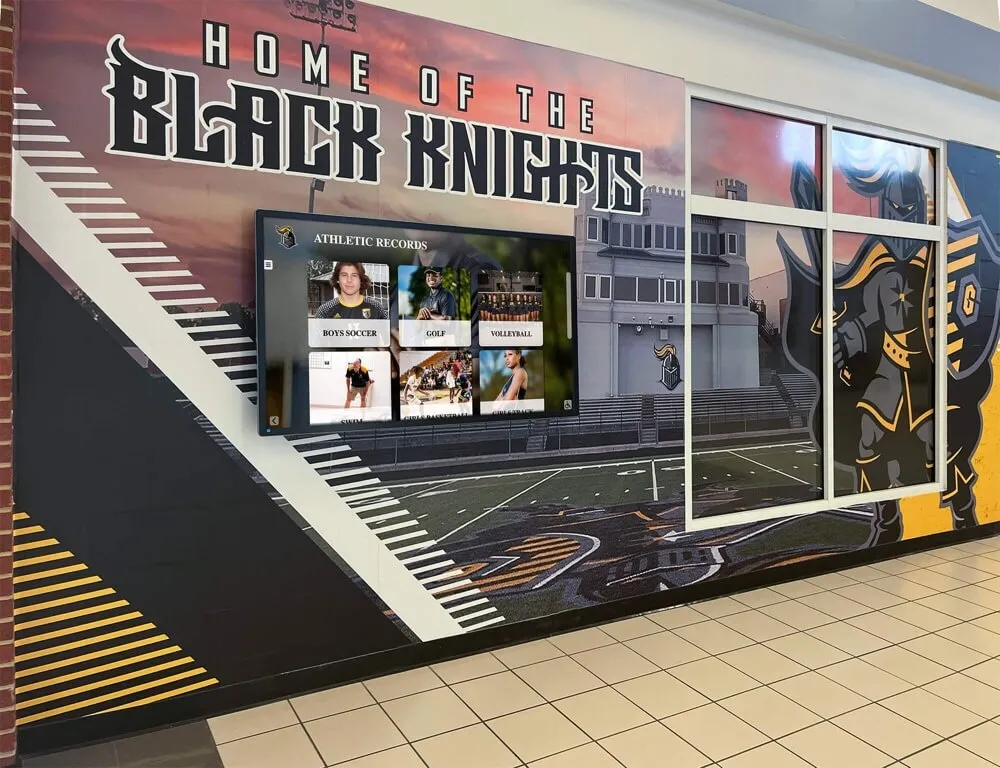
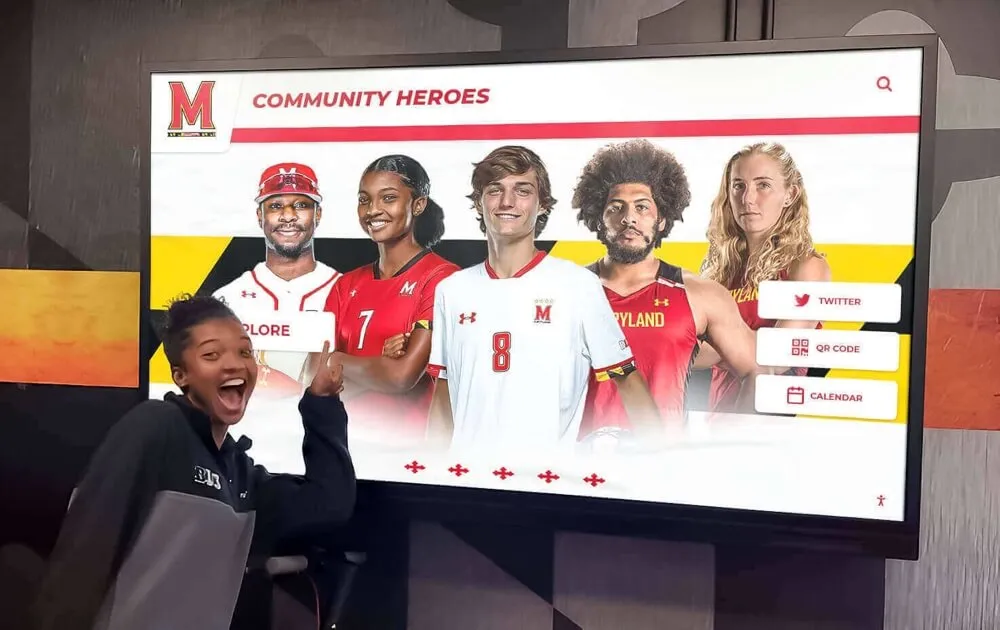
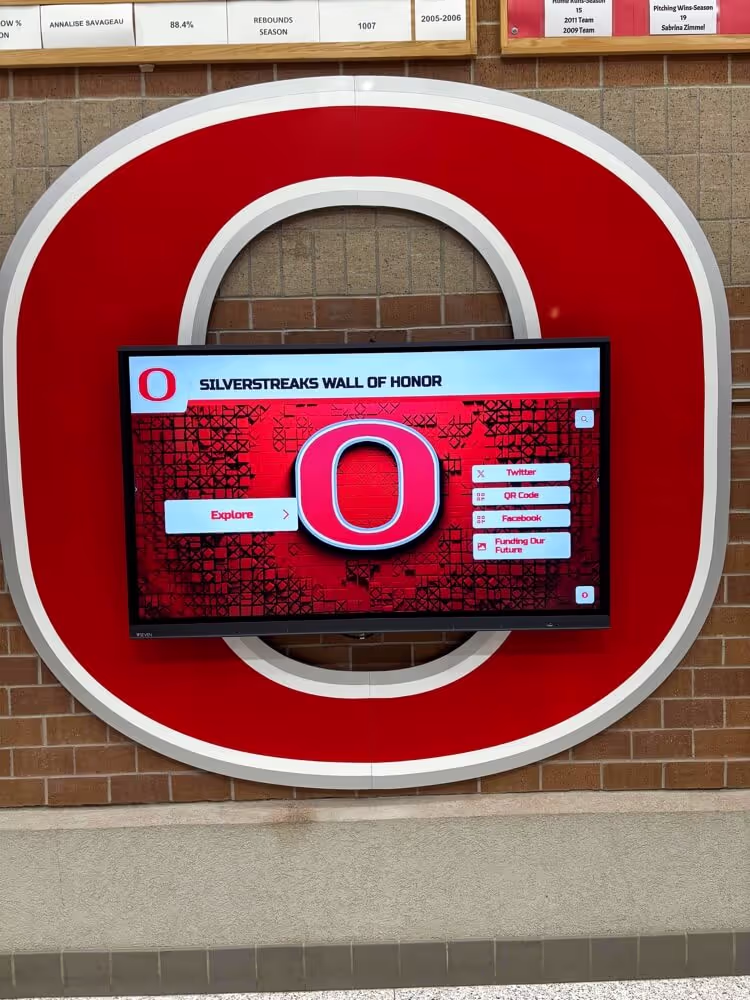
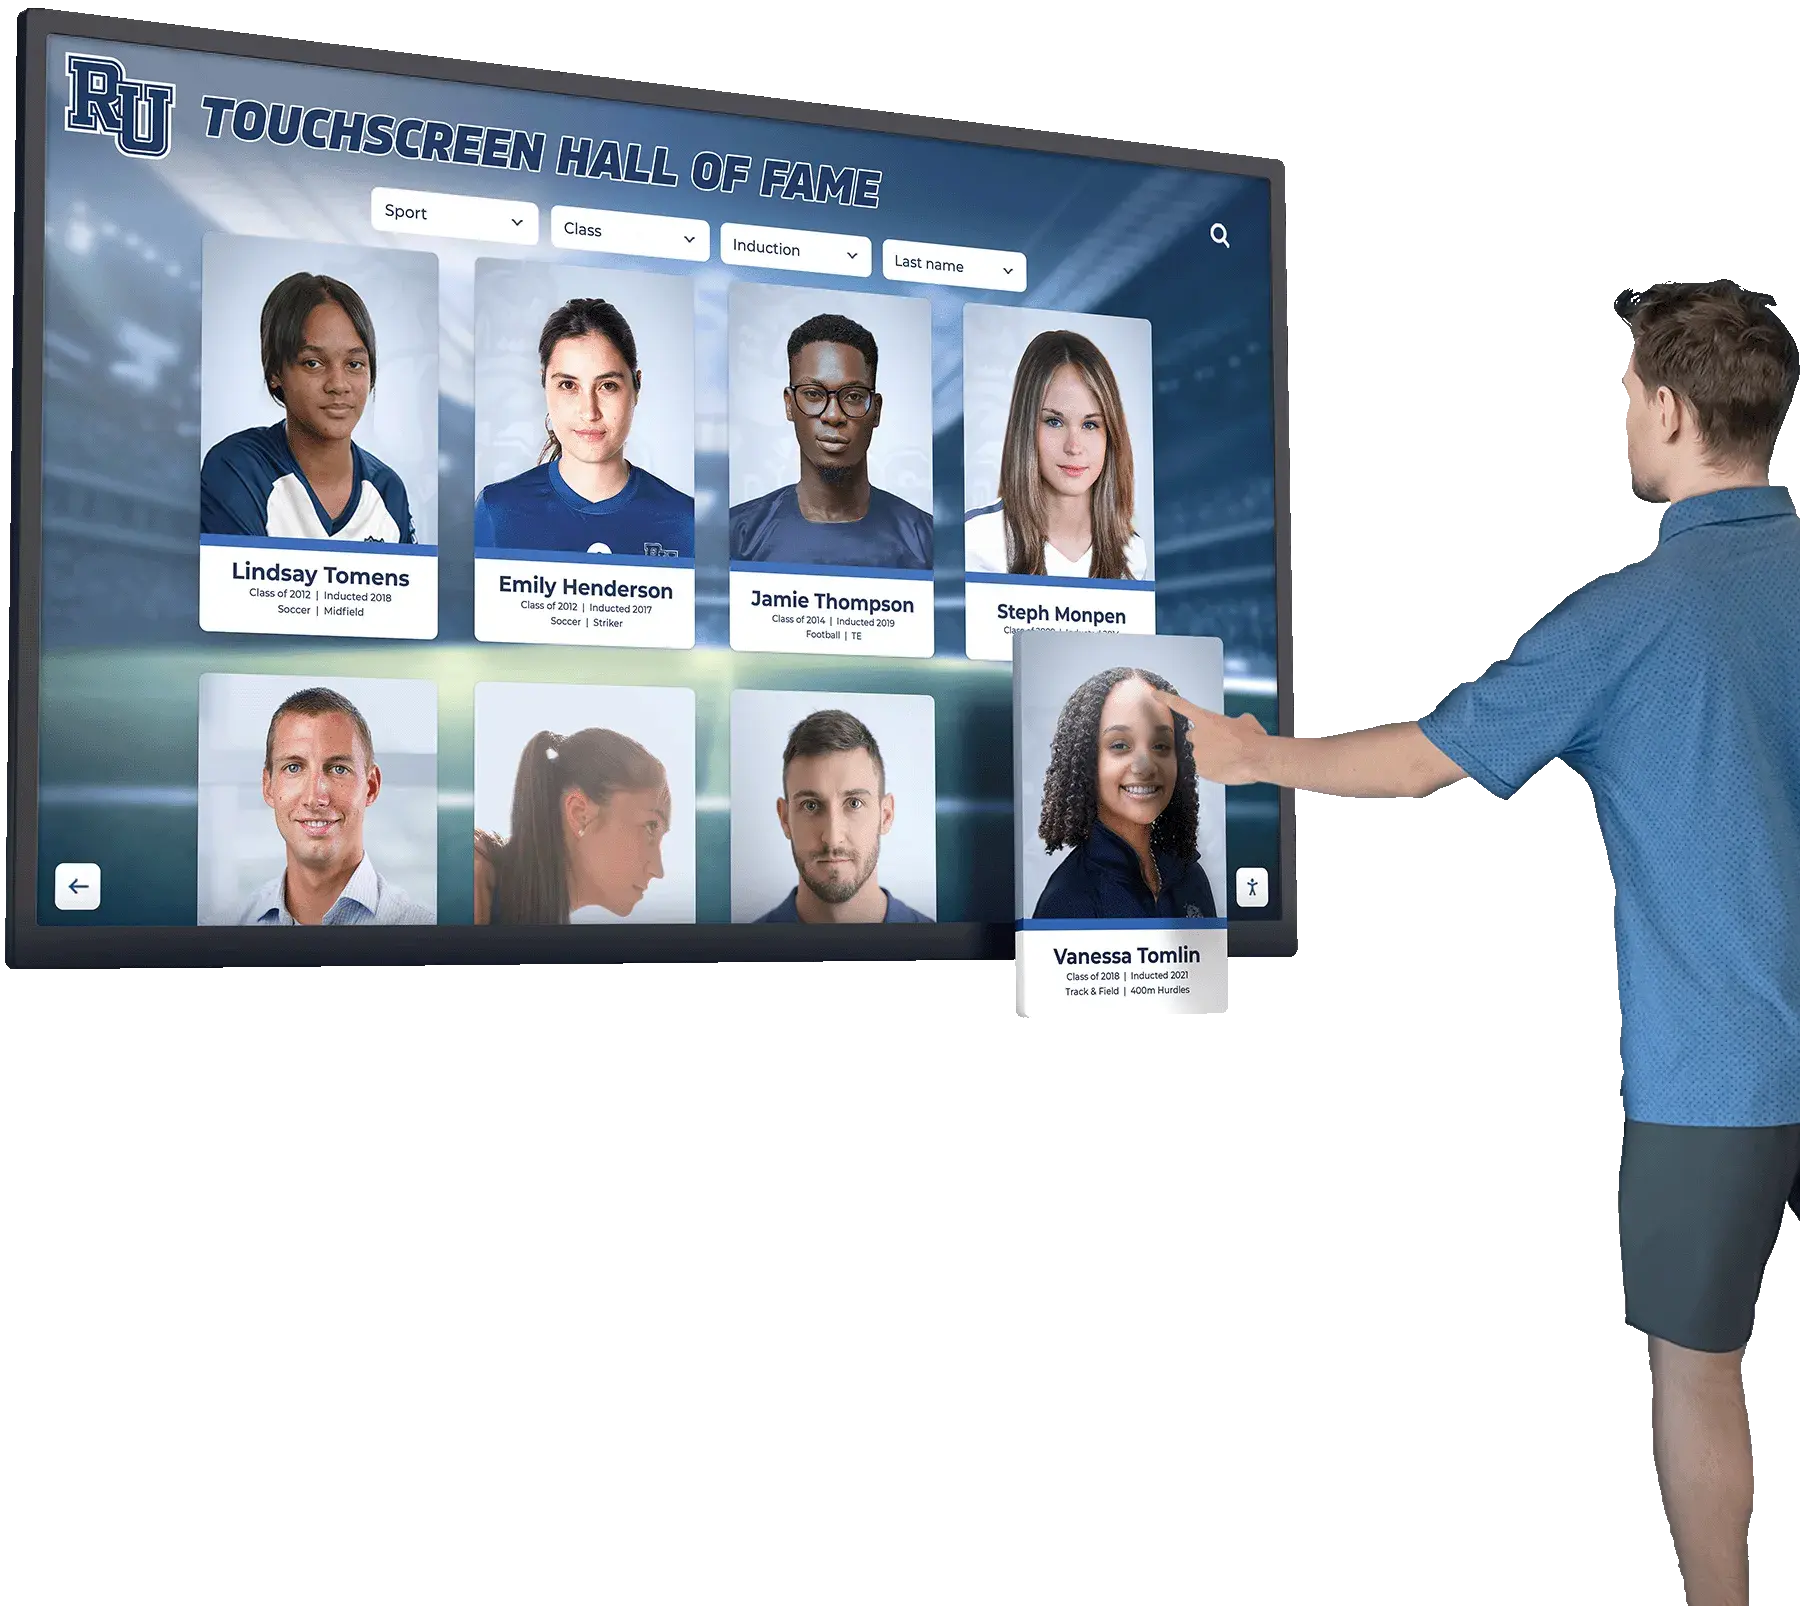
Real-time analytics dashboards provide actionable insights into how visitors interact with your digital recognition displays
Why Measurement Matters: The Case for Data-Driven Recognition
Before diving into specific metrics, it’s crucial to understand why measurement is essential for digital recognition programs:
Prove Value to Stakeholders
When budget reviews arrive, concrete data demonstrating usage, engagement, and impact transforms your digital hall of fame from a "nice to have" into a proven institutional asset that justifies continued investment.
Identify Content Opportunities
Analytics reveal which achievements and stories resonate most with visitors, guiding content development to create more of what your community values.
Optimize User Experience
Tracking navigation patterns and drop-off points highlights usability issues, allowing you to refine interfaces and improve visitor satisfaction.
Demonstrate Institutional Impact
Connecting display analytics with broader institutional goals like alumni engagement, fundraising, and recruitment demonstrates how recognition technology supports strategic objectives.
The Digital Hall of Fame Analytics Framework: Four Metric Categories
Effective measurement requires a balanced approach across four key categories. Let’s explore each in detail.
Category 1: Core Engagement Metrics
These fundamental metrics reveal how visitors interact with your touchscreen hall of fame on a basic level.
| Metric | What It Measures | Good Benchmark | Action Triggers |
|---|---|---|---|
| Total Daily Users | Number of unique interaction sessions per day | 25-100+ depending on location traffic | Declining trend indicates visibility or interest issues |
| Average Session Duration | How long visitors actively engage with content | 5-10 minutes for engaging displays | Under 3 minutes suggests content or usability problems |
| Interaction Rate | Percentage of passersby who engage vs. walk past | 15-30% in high-traffic areas | Low rates may indicate attraction screen issues |
| Profiles Viewed Per Session | Content exploration depth per visitor | 6-12 profiles or pages | Low numbers suggest navigation friction |
| Return Visitor Rate | Percentage who engage multiple times | 20-35% for on-campus displays | High return rates indicate compelling content |
Pro Tip: Track these metrics across different times and days to identify peak usage periods. Many schools discover their digital halls of fame sees highest engagement during lunch hours, after school, or during events—insights that can inform content scheduling and promotional timing.
Category 2: Content Performance Metrics
Understanding which content resonates helps you create more of what your community values.
Most-Viewed Content
Track which profiles, achievements, categories, and time periods receive the most attention. This reveals visitor interests and helps prioritize content development efforts.
For example, if analytics show that athletic achievements from the 1980s receive surprisingly high engagement, consider expanding that era’s content with additional photos, video interviews with coaches, or behind-the-scenes stories about championship seasons.
Search Query Analysis
Every search query represents a visitor’s explicit interest. Analyzing search data reveals:
- Popular Topics: What people are actively looking for
- Content Gaps: High-volume searches that yield few or no results indicate missing content opportunities
- Naming Conventions: How visitors think about your content (do they search “football” or “soccer”?)
- Seasonal Patterns: When interest in specific topics peaks
"Our analytics revealed that 'scholarship winners' was the third most-searched term, but we only had minimal scholarship recognition content. That insight led us to create a comprehensive scholarship donor and recipient section that became one of our most-viewed areas. The data told us exactly what our community wanted to see."
— Director of Development, Mountain View High School
Navigation Path Analysis
Understanding how visitors move through your content reveals:
- Which entry points are most effective
- Common pathways between related content
- Where visitors typically end their sessions
- Dead ends or confusion points in navigation
This intelligence allows you to optimize navigation, create strategic content connections, and remove friction from the user experience.
Media Engagement Rates
For displays featuring videos, photo galleries, or interactive elements, track:
- Video completion rates: What percentage watch entire videos vs. abandoning early
- Gallery engagement: How many photos visitors view in multi-image galleries
- Interactive element usage: Which features (timelines, maps, games) get used
Low engagement with specific media types might indicate technical issues, poor content quality, or placement problems requiring attention.
Category 3: Stakeholder Impact Metrics
These metrics connect your digital hall of fame to broader institutional goals and demonstrate real-world impact.
Alumni Engagement
- Web portal visits from alumni
- Profile update submissions
- Social media shares of content
- Event attendance correlation
- Alumni association membership trends
Fundraising Attribution
- Donor recognition views vs. contributions
- Campaign goal progress displays
- Giving page traffic from display QR codes
- Donor tier engagement patterns
- Recognition program inquiries
Recruitment Influence
- Prospective student family interactions
- Tour group engagement observations
- Mentions in admission surveys
- Campus visit feedback correlation
- Competitive advantage perception
While these metrics often require connecting data from multiple systems, they provide the most compelling evidence of your digital recognition program’s value to institutional leadership.
Consider implementing brief on-screen surveys asking visitors about their relationship to the institution (prospective student, current student, alumni, parent, community member) to segment analytics and better understand how different audiences engage with your content.
Category 4: Technical Performance Metrics
Don’t overlook the importance of monitoring technical health to ensure optimal visitor experience.
- System Uptime: Percentage of time the display is fully operational
- Response Times: How quickly the system responds to touch interactions
- Error Rates: Frequency of software errors or content loading failures
- Network Performance: Connection speed and reliability for cloud-based content
- Hardware Health: Display brightness, touch sensitivity, and component status
Most modern digital hall of fame platforms like those from Rocket Alumni Solutions include automated monitoring that alerts administrators to technical issues before they significantly impact user experience. Target 99%+ uptime for displays in prominent locations.
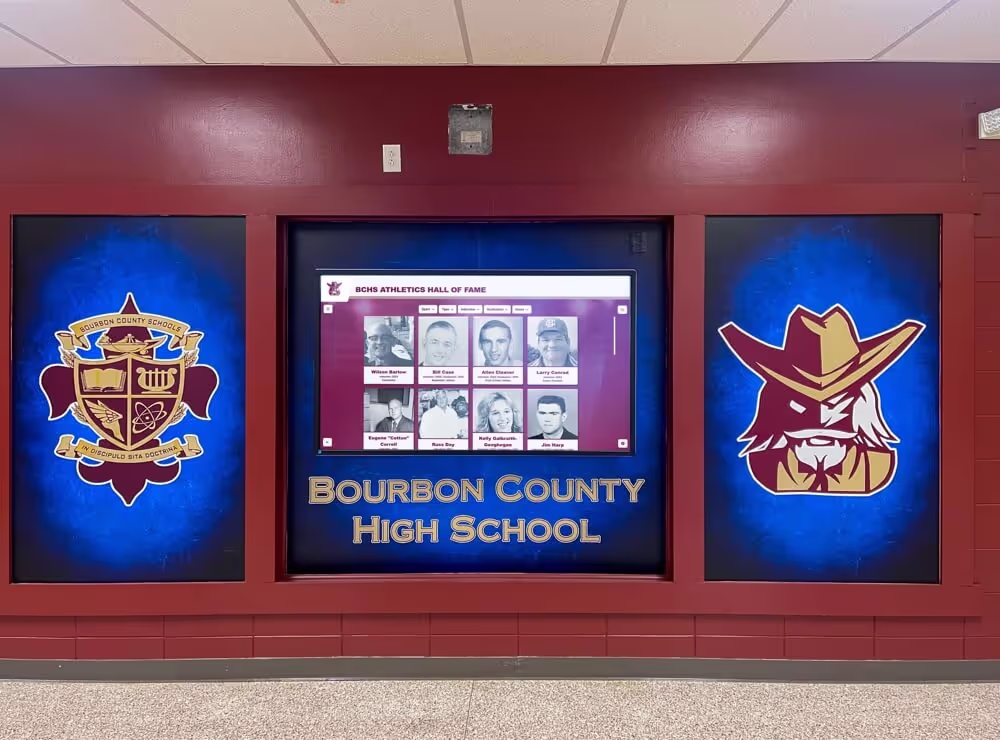
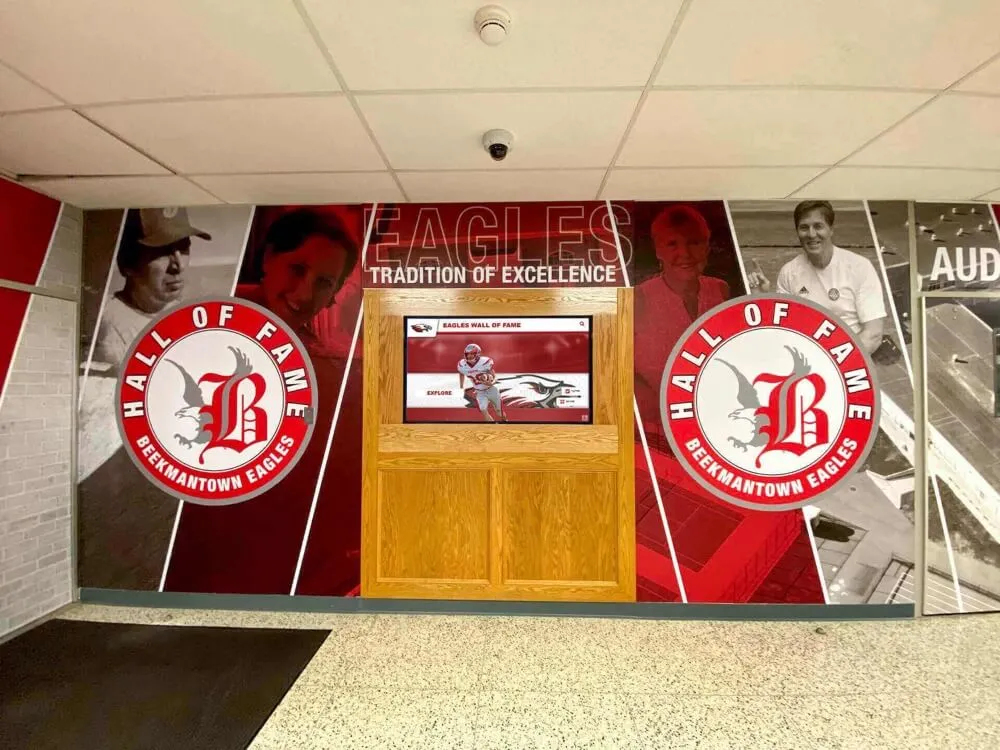
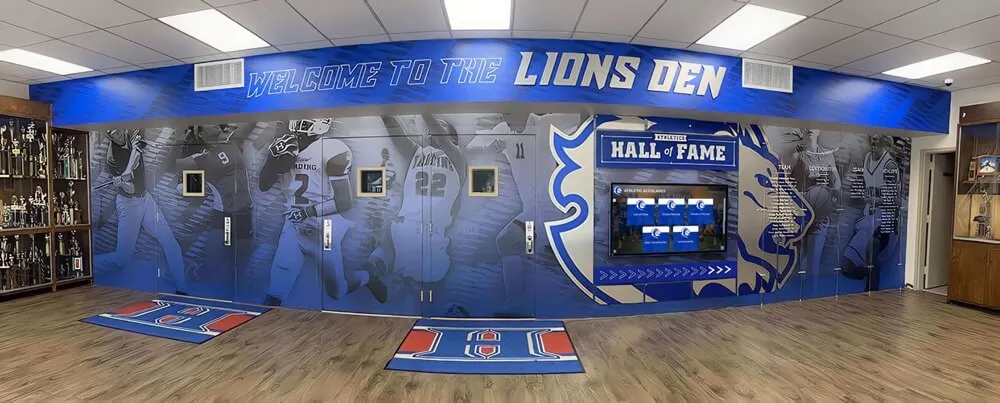
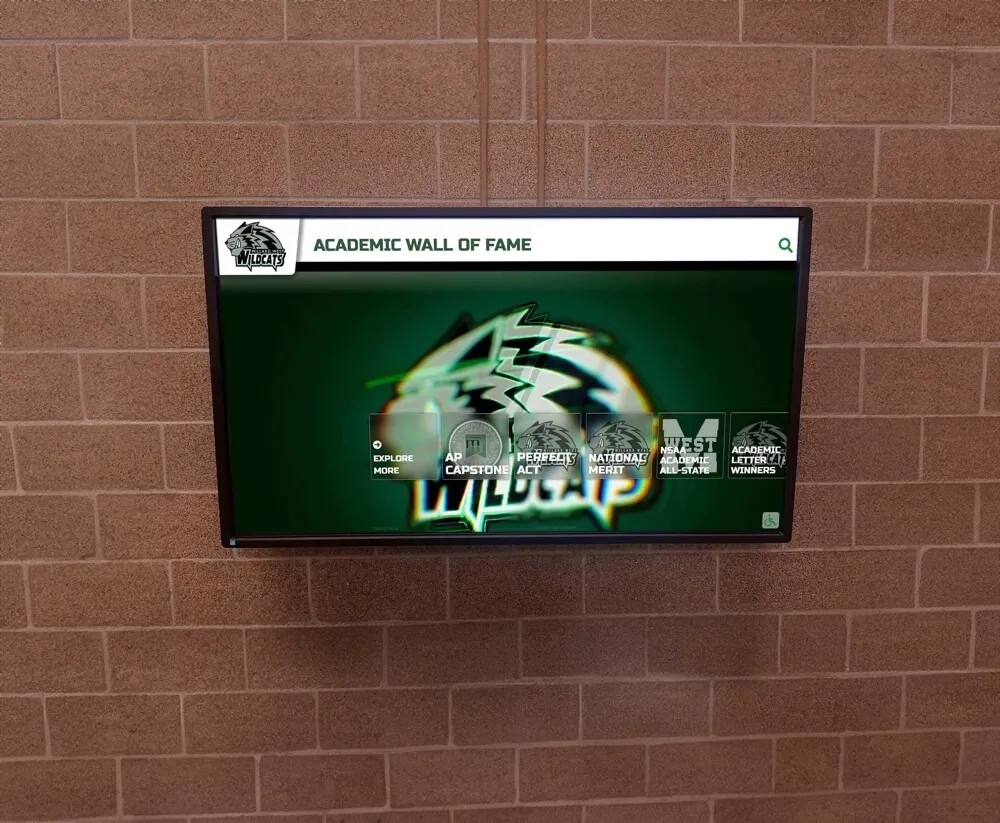
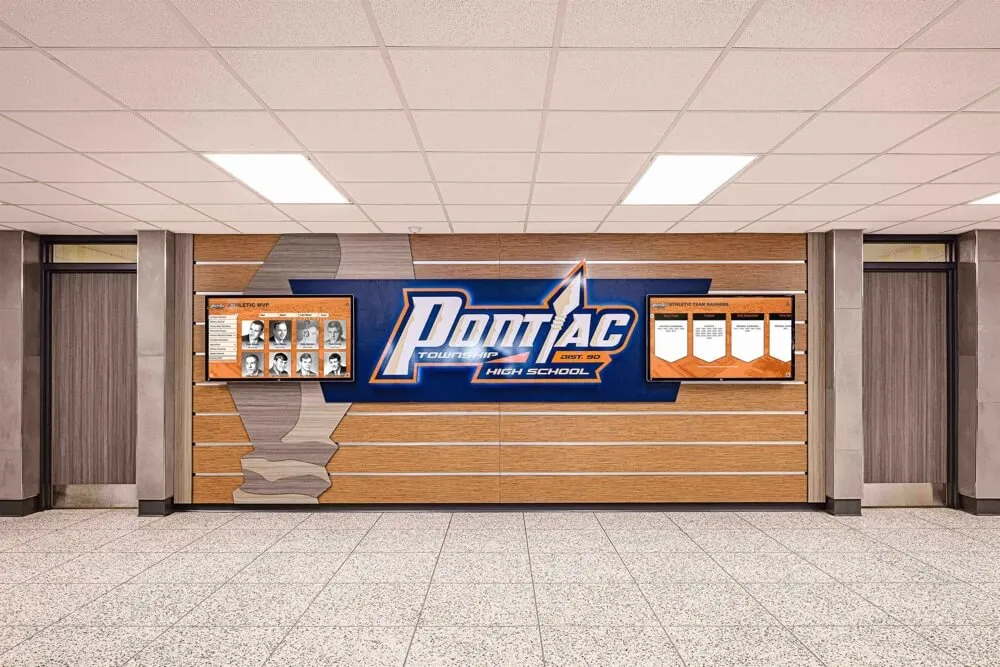
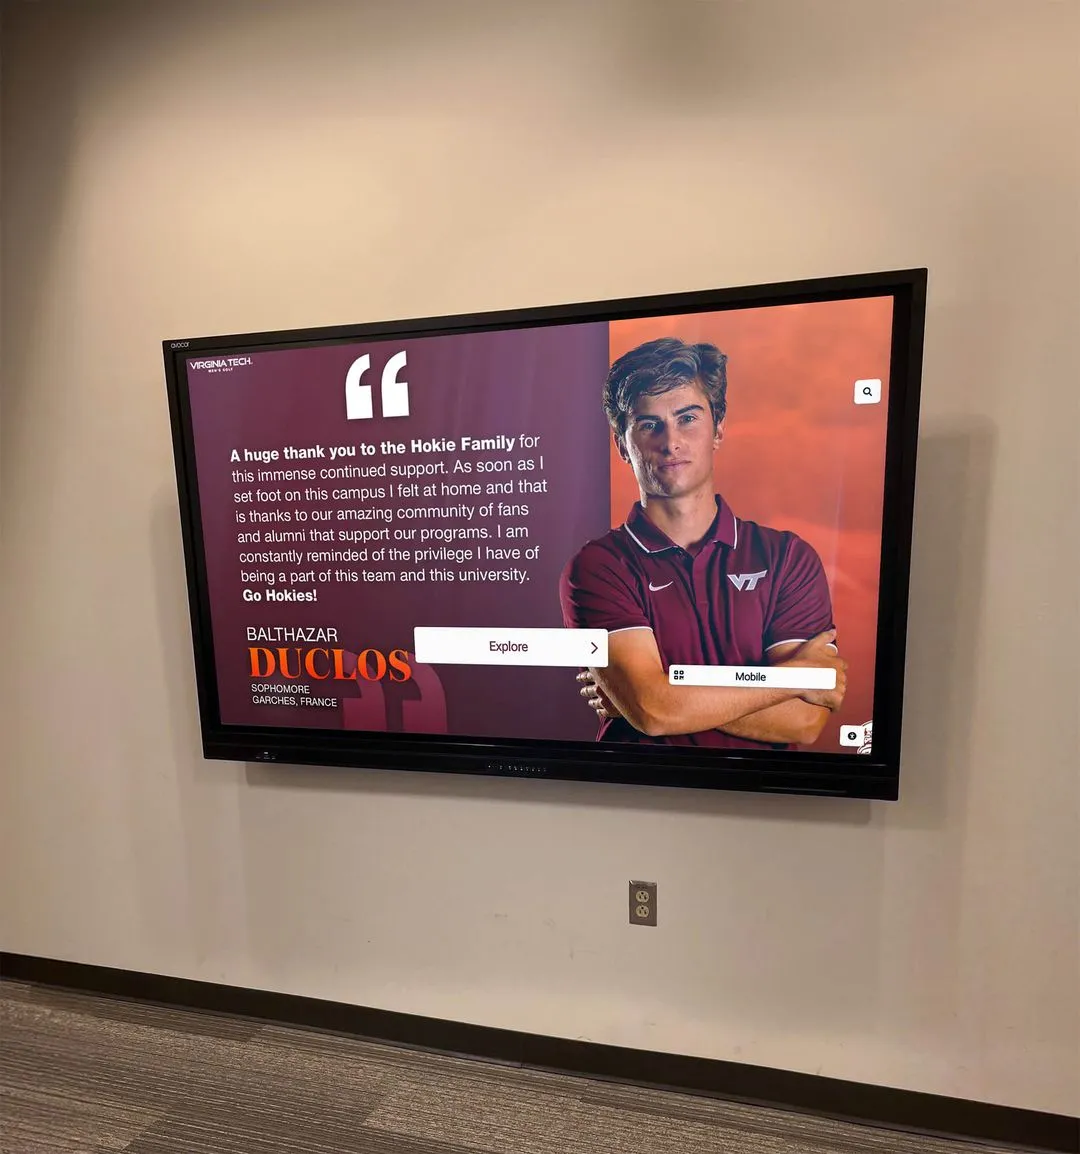
Regular analytics reviews help staff identify opportunities and optimize content strategy
Implementing Your Analytics Strategy: A Practical Framework
Understanding what to measure is only the first step. Here’s how to implement an effective analytics program for your interactive alumni display.
Step 1: Define Clear Goals and KPIs
Before diving into data, establish what success looks like for your institution. Different schools have different priorities:
Example Goal-Setting Exercise:
Sample Institutional Goals → KPIs
Goal: Increase alumni engagement and connection to campus
Primary KPIs:
- 30% of local alumni interact with web-accessible display within first year
- Average session duration exceeds 6 minutes
- 25%+ return visitor rate among identified alumni users
- 15% increase in alumni event attendance correlated with display launch
Goal: Enhance prospective student/family campus visit experience
Primary KPIs:
- 80%+ of tour groups interact with display during campus visits
- Positive display mentions in 40%+ of post-visit surveys
- Average 8+ minute engagement during tours
- Increase in “impressed by facilities” ratings in admission surveys
Your goals should align with broader institutional strategic priorities and be specific enough to measure progress objectively. Solutions like those at TouchHallofFame.us can be configured to track goals specific to your needs.
Step 2: Establish a Regular Review Cadence
Create a sustainable analytics review rhythm:
Weekly Quick Check (15 minutes):
- Total users vs. previous week
- System uptime and technical issues
- Top 5 most-viewed content pieces
- Any unusual patterns requiring immediate attention
Monthly Deep Dive (60 minutes):
- Trend analysis across all core metrics
- Content performance comparisons
- Navigation pattern review
- User feedback compilation
- Quarterly goal progress check
Quarterly Strategic Review (2-3 hours):
- Comprehensive performance against annual goals
- Stakeholder impact assessment
- Content strategy adjustments
- Technical optimization opportunities
- Budget and resource planning
Step 3: Create Actionable Reports for Different Audiences
Different stakeholders need different information:
For Executive Leadership:
- High-level dashboard showing key metrics vs. goals
- Stakeholder impact summary (alumni engagement, fundraising, recruitment)
- ROI analysis and cost-benefit summary
- Strategic recommendations
For Content Managers:
- Detailed content performance rankings
- Search query analysis with content gap identification
- Navigation flow diagrams
- Specific optimization recommendations
For Technical Teams:
- System performance metrics
- Technical issue log and resolution status
- Capacity and scaling considerations
- Integration performance
For Marketing/Advancement:
- Alumni engagement statistics
- Social sharing and digital reach metrics
- Event correlation data
- Success stories and testimonials
Step 4: Turn Insights into Action
Data without action is just interesting trivia. Establish a process for translating analytics insights into concrete improvements:
| Analytics Insight | Potential Actions |
|---|---|
| Declining session duration | Refresh content with new photos/videos; improve navigation; add interactive elements; fix technical issues |
| High search volume with no results | Create content addressing these searches; improve search algorithm; add related content suggestions |
| Specific era/category highly popular | Expand that content area; promote similar content; create themed tours or features |
| Low video completion rates | Shorten videos; improve opening hooks; check audio levels; test on actual hardware |
| Peak usage during specific times | Schedule featured content for peak times; plan content updates around usage patterns; staff promotion during peaks |
| Low return visitor rate | Increase content update frequency; add "new additions" section; implement notification system |
Establish a monthly “optimization sprint” where your team reviews analytics, identifies the top 2-3 opportunities, and implements improvements. This regular cadence ensures continuous enhancement rather than letting issues accumulate.
Advanced Analytics Strategies for Maximum Impact
Once you’ve mastered the basics, consider these advanced approaches to extract even more value from your digital hall of fame analytics.
A/B Testing for Content Optimization
Modern digital record boards and recognition displays can test different approaches to determine what works best:
- Content Formats: Test longer vs. shorter profiles, video-first vs. photo-first layouts
- Navigation Structures: Compare different organizational schemes
- Visual Designs: Test color schemes, typography, or layout variations
- Call-to-Action Placement: Experiment with where to place “Learn More” or “Share This” buttons
Run tests for meaningful periods (typically 2-4 weeks) with sufficient traffic to reach statistical significance before making permanent changes.
Cohort Analysis for Deeper Insights
Segment visitors into cohorts based on when they first interacted with your display, then track how behavior evolves:
- Do first-time visitors return? How often?
- Does engagement increase or decrease over time?
- Which initial experiences lead to highest return rates?
- How do different onboarding approaches affect long-term engagement?
This analysis helps optimize the new visitor experience and identify what creates lasting connections.
Heat Mapping and Attention Tracking
Some advanced interactive touchscreen software includes heat mapping capabilities that visually show where visitors tap, swipe, and focus attention. This reveals:
- Which screen areas attract the most attention
- Elements that get overlooked despite importance
- Navigation patterns and common pathways
- Optimal placement for key content or calls-to-action
Heat maps provide intuitive visual representations that make analytics accessible even to non-technical stakeholders.
Predictive Analytics and Trend Forecasting
As you accumulate historical data, you can identify patterns and trends that inform strategic planning:
- Seasonal engagement variations
- Content lifecycle patterns (how quickly interest in new content decays)
- Event impact predictions (how campus events affect display usage)
- Long-term growth trajectories
This forward-looking perspective helps with content planning, resource allocation, and setting realistic future goals.
"After implementing comprehensive analytics tracking for our touchscreen hall of fame, we discovered that engagement doubled during homecoming week but dropped significantly during summer months. We now schedule our biggest content updates for late August and early October to maximize impact when campus activity peaks. This data-driven approach has increased our average monthly engagement by 40%."
— Alumni Relations Director, Lakeside University
Calculating ROI: Proving Financial Value
While engagement metrics demonstrate usage, stakeholders often want to see financial justification for digital recognition investments. Here’s how to calculate meaningful ROI.
Quantifiable Cost Savings
| Cost Category | Traditional Annual Cost | Digital Annual Cost | Annual Savings |
|---|---|---|---|
| Physical plaques/trophies | $2,500-$5,000 | $0 | $2,500-$5,000 |
| Printing and framing | $1,500-$3,000 | $0 | $1,500-$3,000 |
| Physical space utilization | $3,000-$8,000 | $500-$1,000 | $2,500-$7,000 |
| Administrative labor | $4,000-$6,000 | $500-$1,000 | $3,500-$5,000 |
| Updates and renovations | $2,000-$4,000 | $0 | $2,000-$4,000 |
| Total Annual Savings | $13,000-$26,000 | $1,000-$2,000 | $12,000-$24,000 |
With annual savings of $12,000-$24,000, a typical $30,000-$50,000 digital hall of fame investment achieves break-even within 2-4 years from cost savings alone—before considering additional value from enhanced engagement, fundraising, or recruitment.
Attributable Revenue Increases
Beyond cost savings, track revenue that can be attributed to your digital donor walls and recognition displays:
- Incremental Donations: Track giving increases from donors whose recognition appears on the display, especially for tiered donor walls showing “gaps” in recognition levels
- Event Revenue: Monitor attendance and sponsorship for homecoming, reunions, and other alumni events promoted through the display
- Merchandise Sales: Some schools include links to alumni merchandise stores from their displays
- Facility Rentals: Enhanced facilities can command premium rental rates
Even modest attribution percentages can significantly impact ROI calculations. If your digital hall of fame contributes to just 5-10% of alumni giving increases, the financial impact can be substantial.
Non-Financial Value Metrics
Not all value is financial. Document these qualitative benefits:
- Institutional Pride: Survey results showing community pride improvements
- Brand Enhancement: Media mentions and social media engagement
- Competitive Positioning: How the display factors into admission and recruitment decisions
- Preservation of History: Value of digitizing and protecting historical materials
- Accessibility Improvements: Expanding recognition access beyond campus visitors
Many institutions find that while the financial ROI justifies the investment, the non-financial benefits—stronger community, preserved legacy, enhanced reputation—provide the most meaningful value. Resources like comprehensive guides to digital record keeping can help frame these benefits.
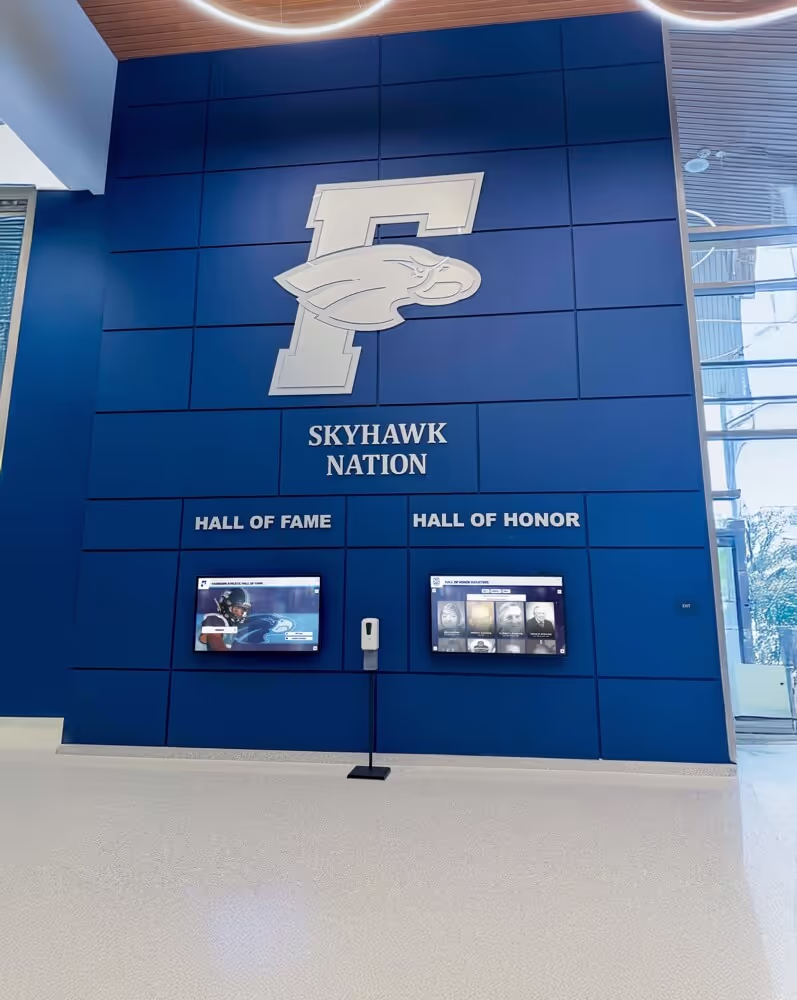
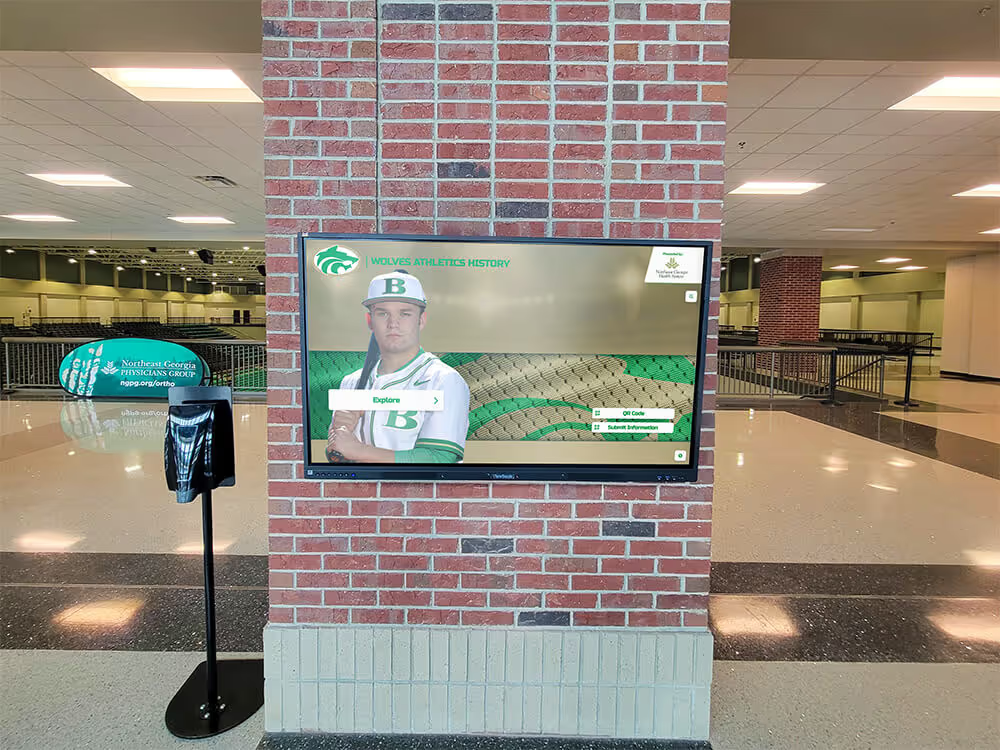
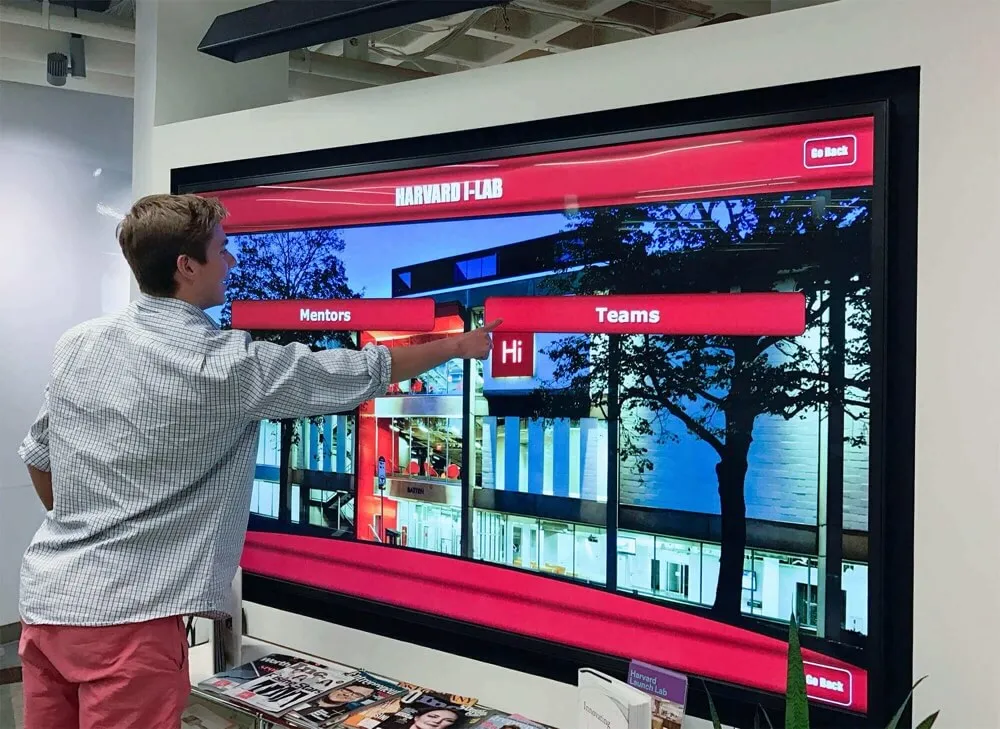
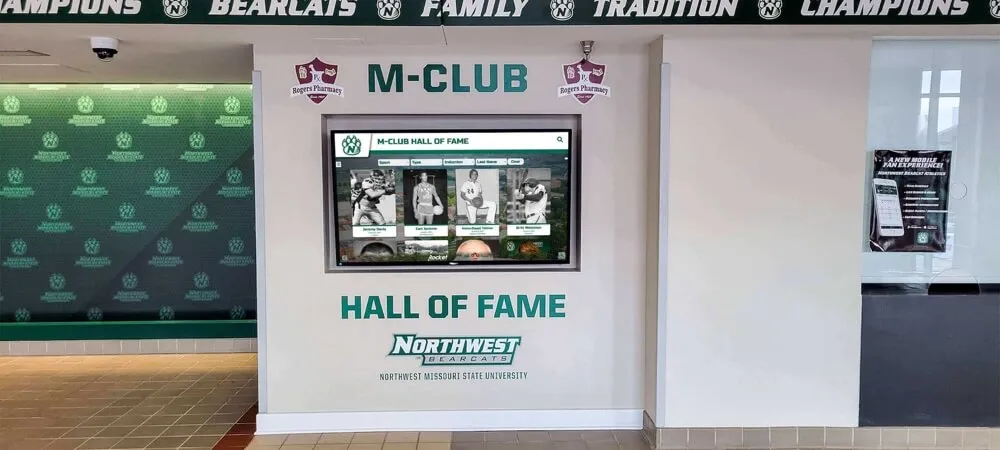
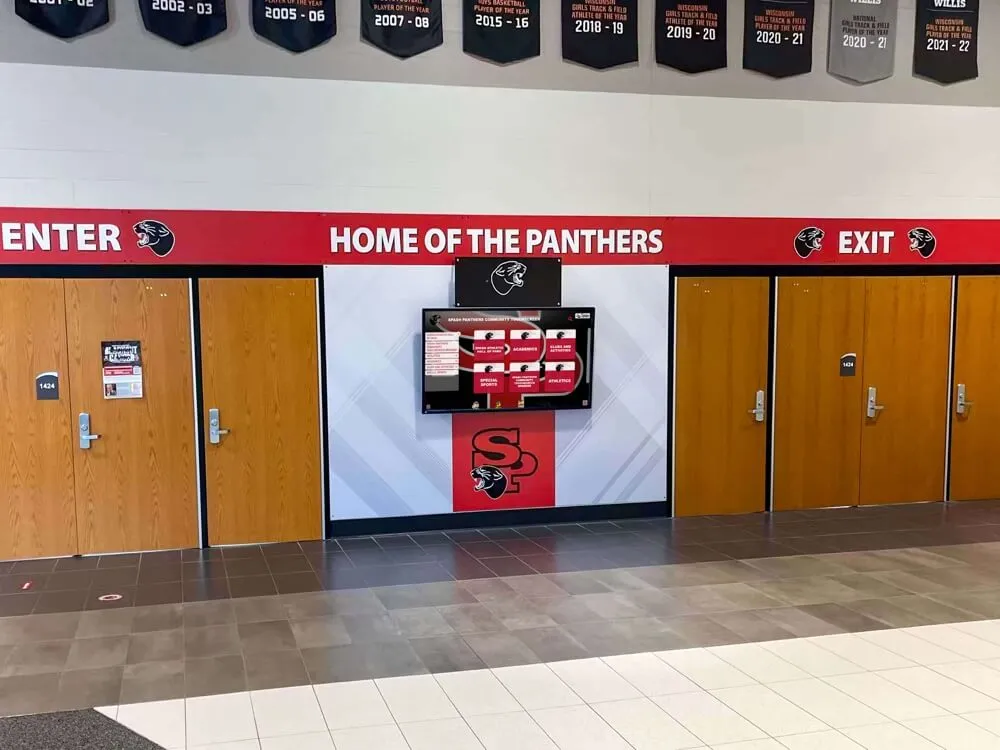
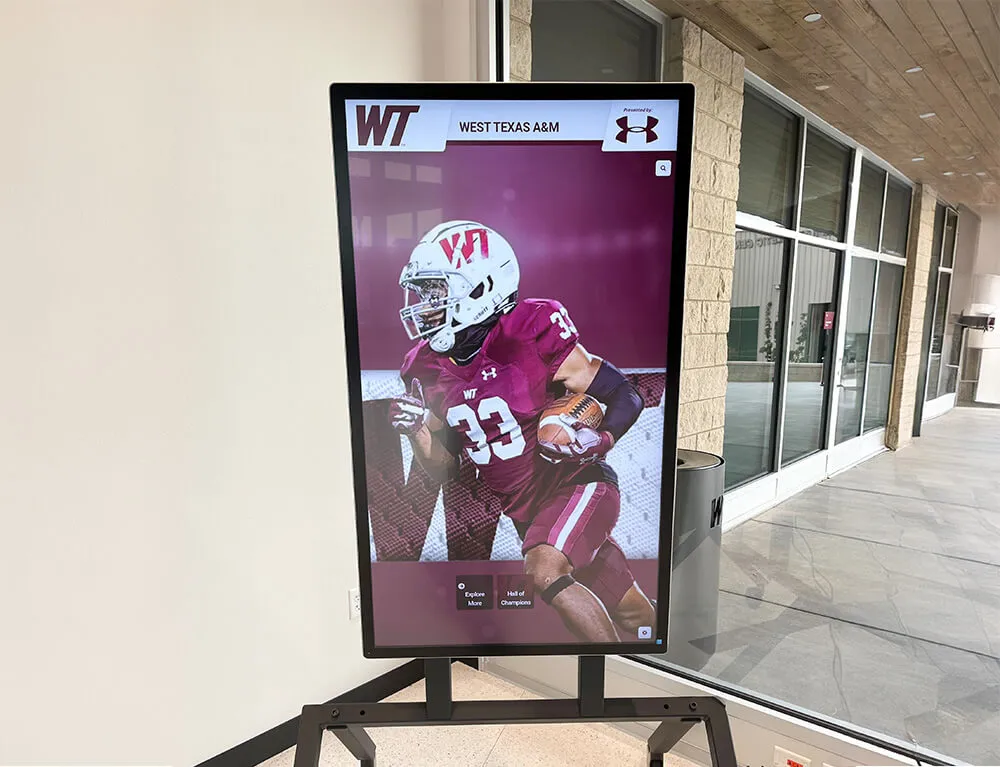
Data-driven success: Schools using comprehensive analytics report higher satisfaction and demonstrable impact
Common Analytics Pitfalls to Avoid
Even with good intentions, institutions often make these measurement mistakes:
Pitfall 1: Tracking Too Much or Too Little
The Problem: Either getting overwhelmed by hundreds of metrics or tracking so little that you miss important insights.
The Solution: Start with 8-10 core metrics covering engagement, content performance, and stakeholder impact. Add additional metrics only when you have specific questions that existing data doesn’t answer.
Pitfall 2: Looking at Data Without Context
The Problem: Seeing a 20% drop in usage and panicking without understanding seasonal patterns or campus events.
The Solution: Always compare data year-over-year and account for institutional calendar factors. A summer drop is normal; a drop during homecoming week indicates real problems.
Pitfall 3: Analysis Without Action
The Problem: Producing beautiful reports that no one acts upon.
The Solution: Every analytics review should end with 1-3 specific action items with assigned owners and deadlines. If insights don’t lead to action, you’re wasting time.
Pitfall 4: Focusing Only on Volume Metrics
The Problem: Obsessing over total users while ignoring whether those interactions are meaningful.
The Solution: Balance volume (total users) with quality (session duration, content depth, return rates). A hundred engaged visitors provide more value than a thousand who tap once and leave.
Pitfall 5: Ignoring Technical Performance
The Problem: Only tracking user behavior while system problems silently degrade experience.
The Solution: Set up automated technical monitoring with alerts for downtime, slow response times, or error rates that might indicate problems before they significantly impact users.
Tools and Platforms for Digital Hall of Fame Analytics
Selecting the right analytics tools makes measurement easier and more effective. Look for platforms that offer:
- Built-in Analytics Dashboards: Integrated reporting within your content management system
- Customizable Metrics: Ability to track what matters most to your institution
- Real-time Monitoring: See current activity and identify issues quickly
- Automated Reporting: Scheduled reports delivered to stakeholders
- Data Export: Download raw data for deeper analysis in other tools
- Privacy Compliance: Analytics that respect visitor privacy and comply with regulations
Rocket Alumni Solutions provides comprehensive analytics capabilities designed specifically for interactive recognition displays, with intuitive dashboards that make measurement accessible even for non-technical administrators.
For institutions wanting to integrate display data with broader analytics platforms, look for solutions offering API access and integration capabilities with tools like Google Analytics, institutional data warehouses, or alumni management systems.
Creating a Culture of Continuous Improvement
The most successful digital recognition programs view analytics not as a compliance exercise but as a foundation for continuous enhancement. Foster this culture by:
Sharing Success Stories: When analytics-driven improvements produce results, celebrate and share these wins with stakeholders to demonstrate the value of measurement.
Encouraging Experimentation: Create permission for trying new approaches based on data insights, understanding that not every experiment will succeed.
Involving Stakeholders: Share relevant analytics with content contributors, technical teams, and institutional leadership so everyone understands impact and opportunities.
Setting Improvement Goals: Establish quarterly targets for key metrics and track progress transparently.
Learning from Others: Connect with peer institutions to share measurement strategies and benchmarks through forums like those discussing recognition solutions for schools.
Ready to Measure What Matters?
Rocket Alumni Solutions doesn't just provide cutting-edge interactive displays—we partner with you to ensure measurable success through comprehensive analytics, strategic guidance, and ongoing optimization support.
Request Your Analytics ConsultationConclusion: From Data to Impact
A digital hall of fame without measurement is a missed opportunity. With comprehensive analytics tracking the right metrics, you transform your interactive recognition display from a one-time technology investment into a continuously improving strategic asset that demonstrably serves institutional goals.
The metrics and strategies outlined in this guide provide a roadmap for proving value, optimizing performance, and ensuring your digital recognition program delivers maximum impact for years to come. Start with core engagement metrics, expand into content performance and stakeholder impact analysis, and develop the discipline of regular review and action.
Remember that analytics are a means to an end—the ultimate goal is creating meaningful connections between your institution and its community. When you measure effectively and act on insights, your digital halls of fame becomes not just a showcase of past achievements but a catalyst for future excellence.
The institutions that excel at digital recognition are those that commit to continuous measurement, learning, and improvement. Join them in creating data-driven recognition programs that truly matter.