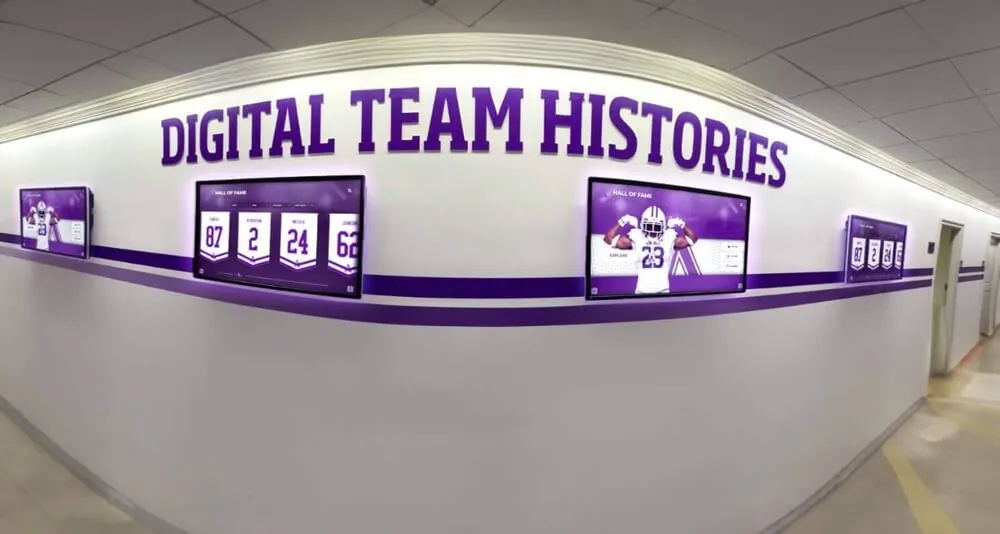
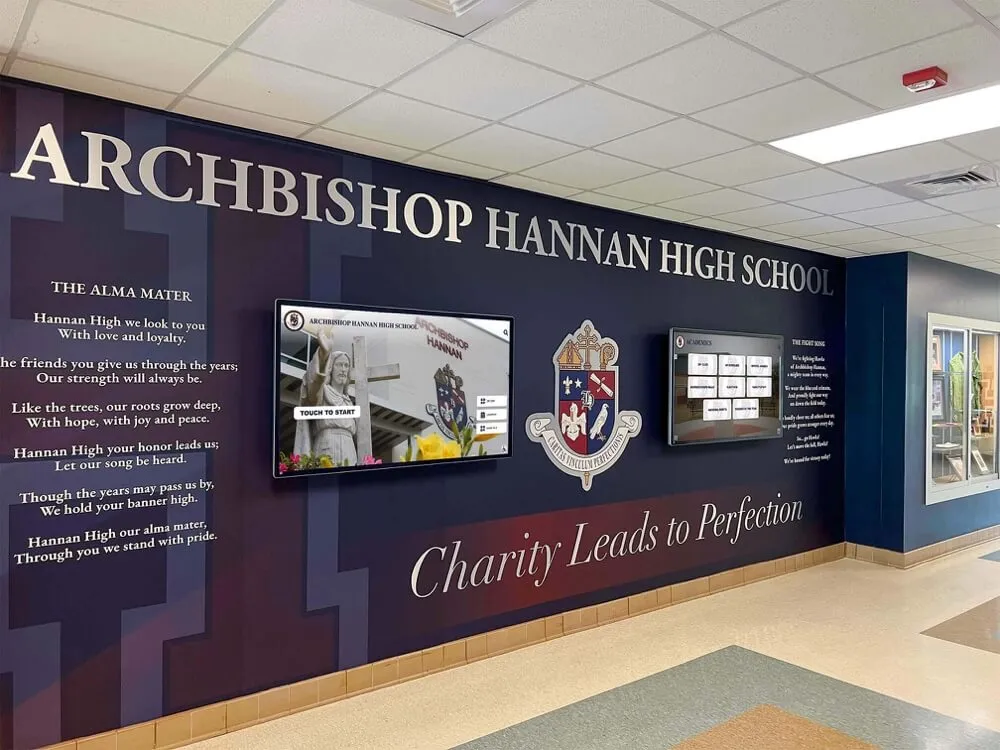
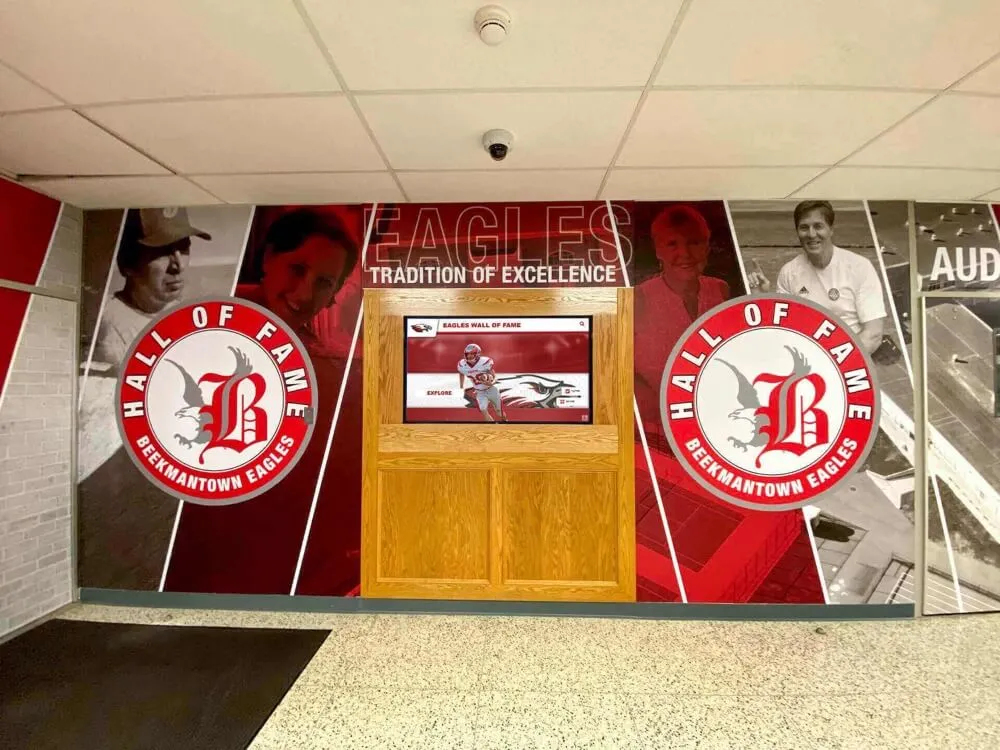
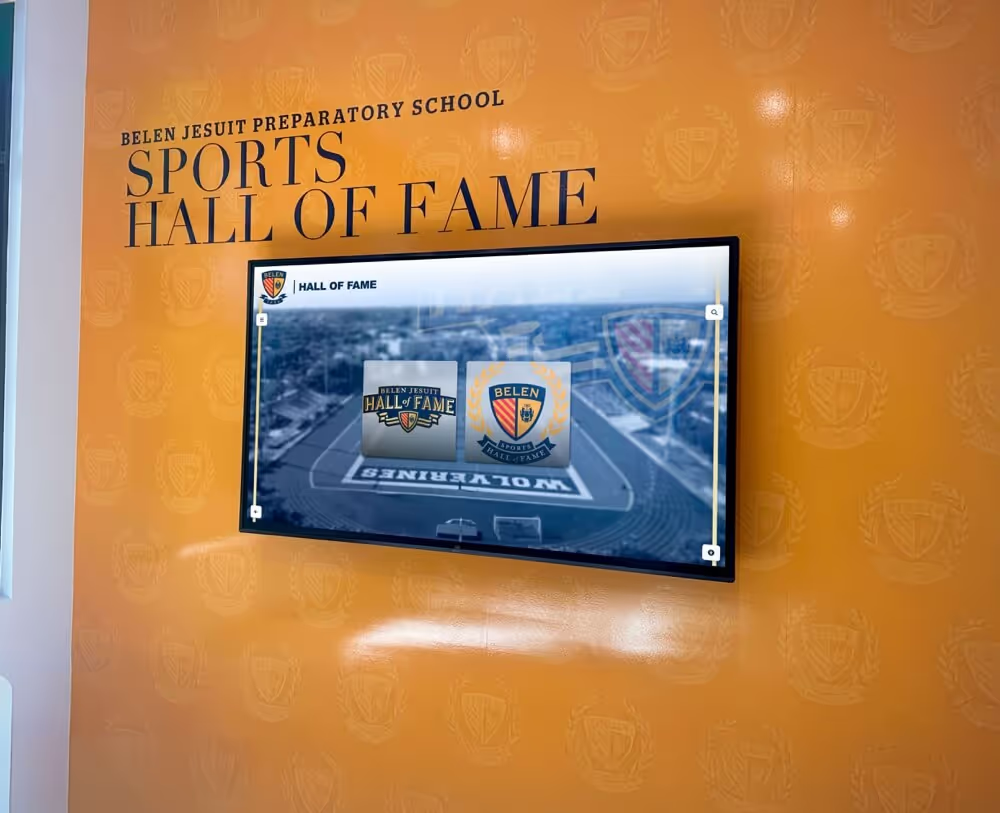
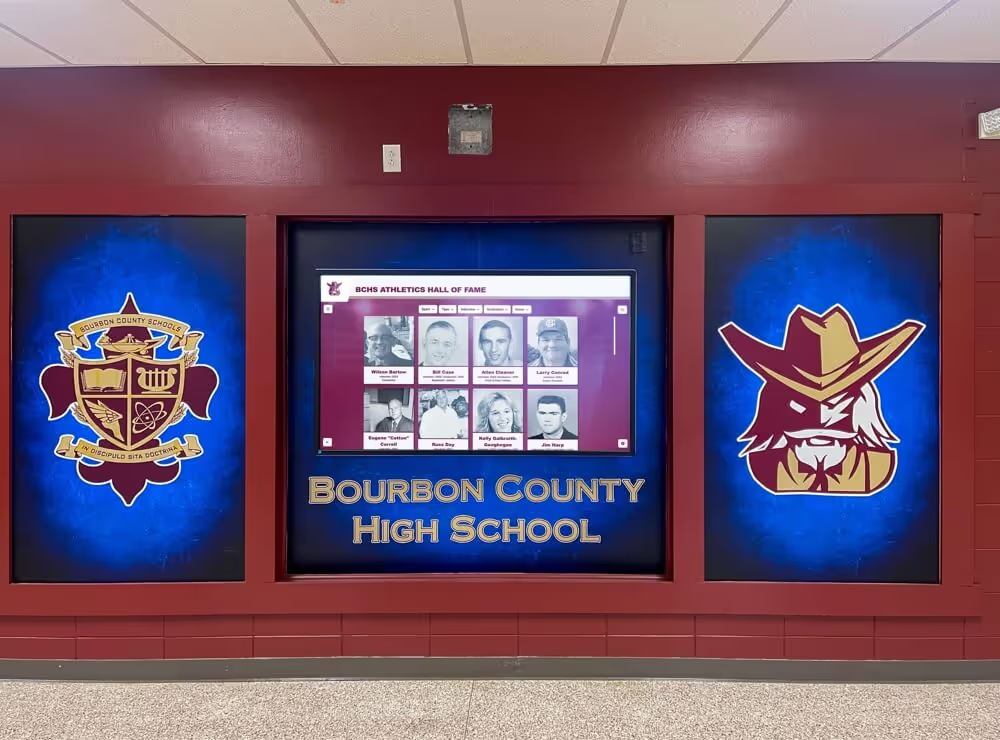
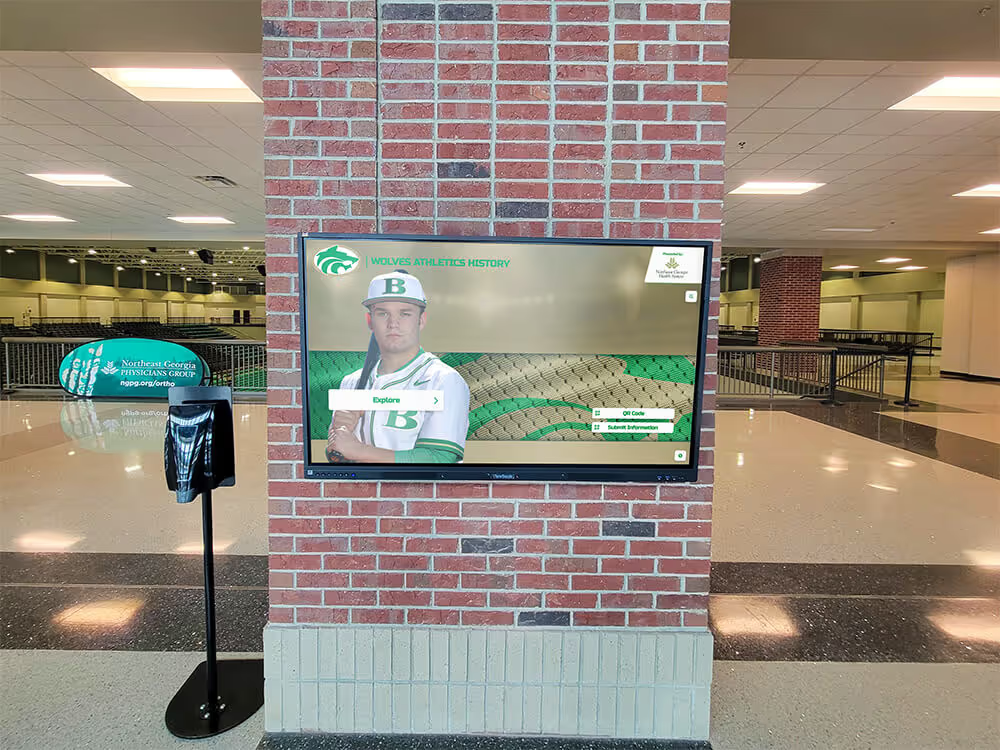
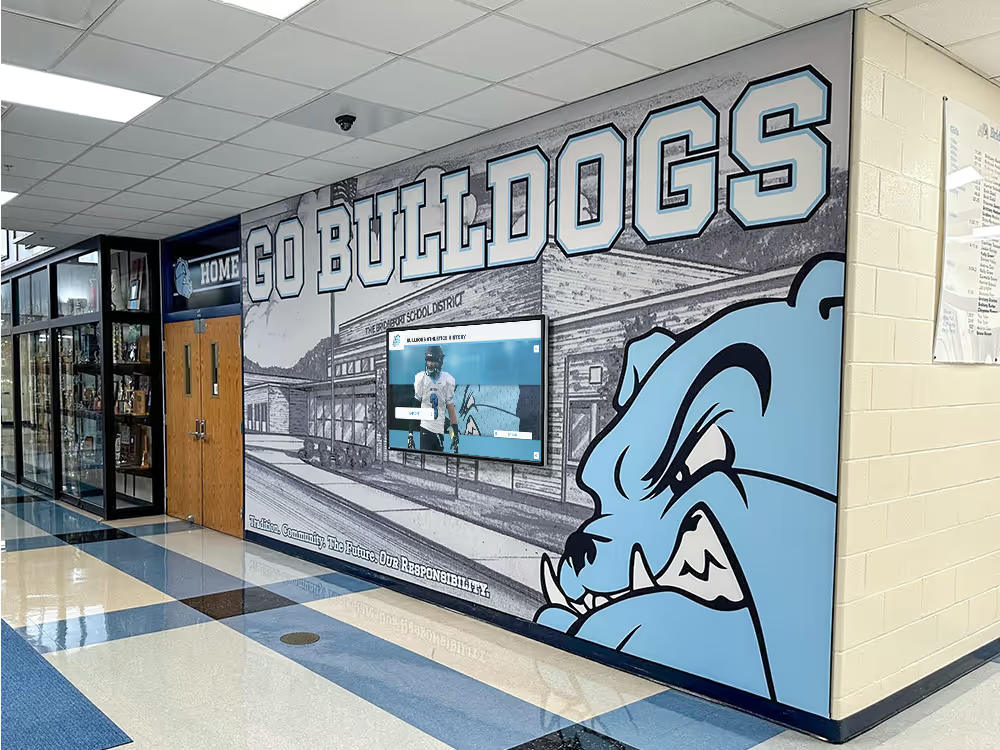
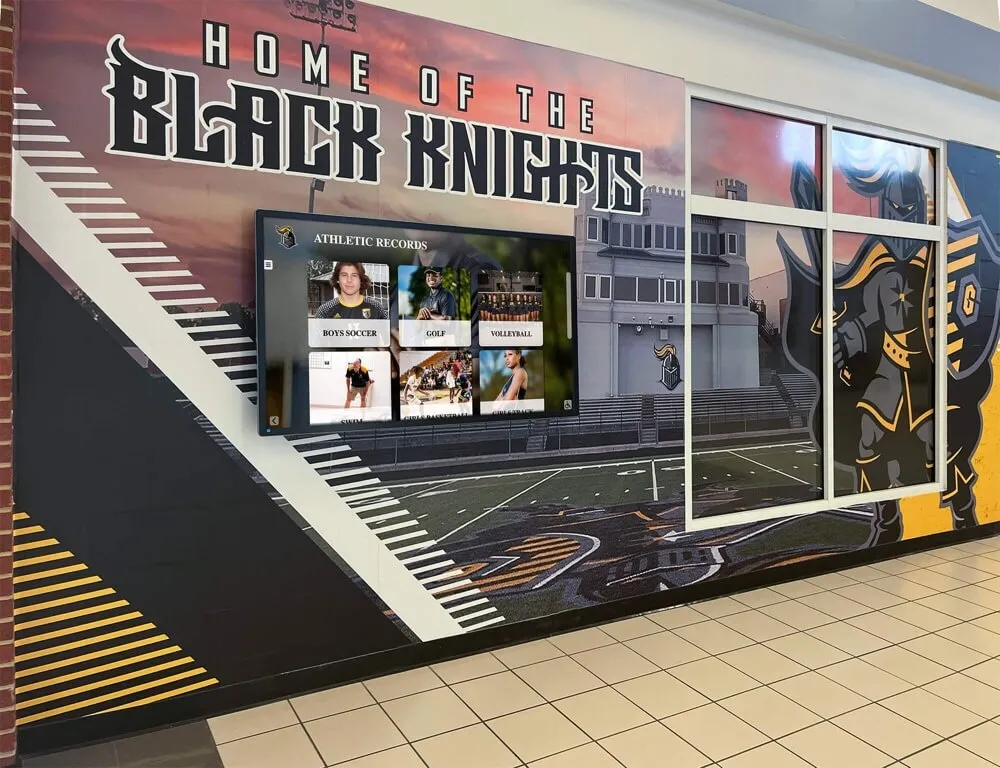
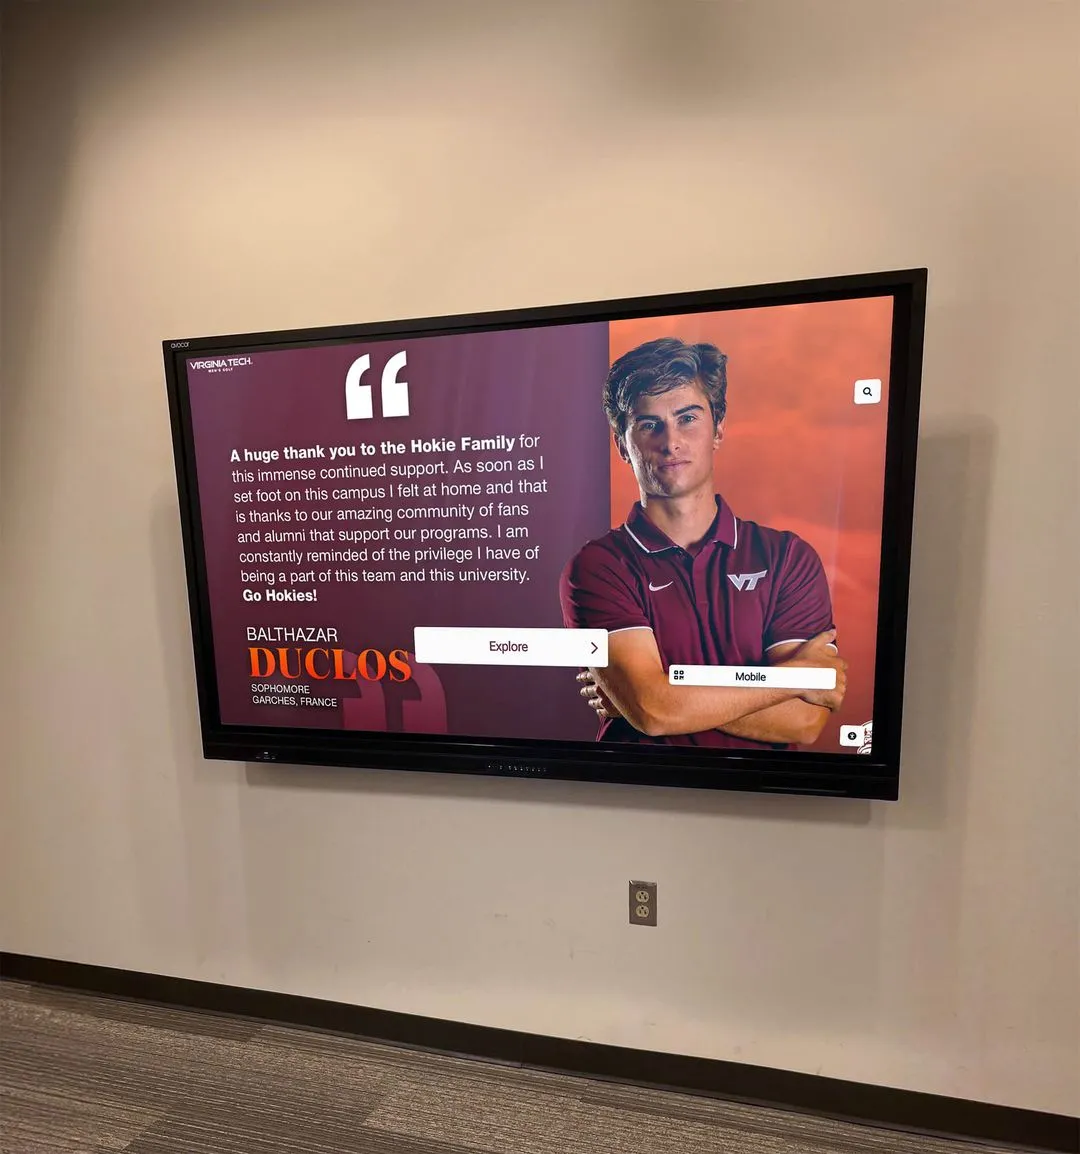
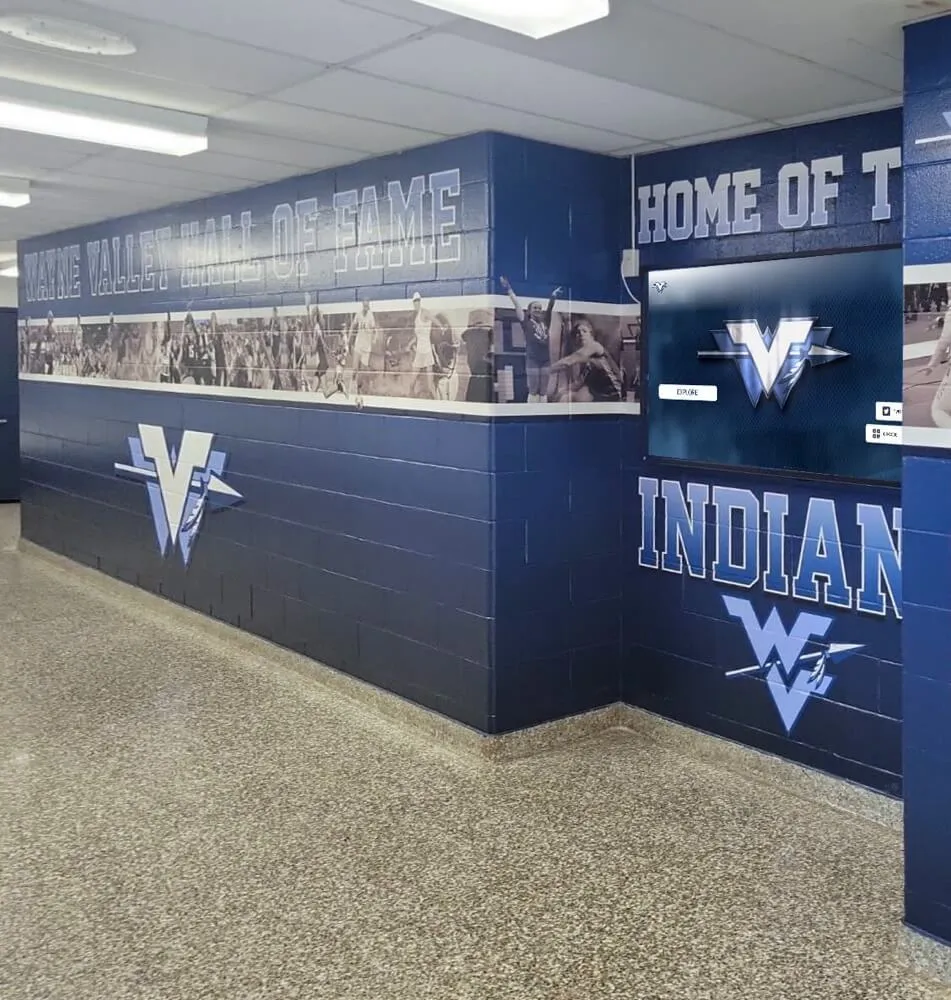
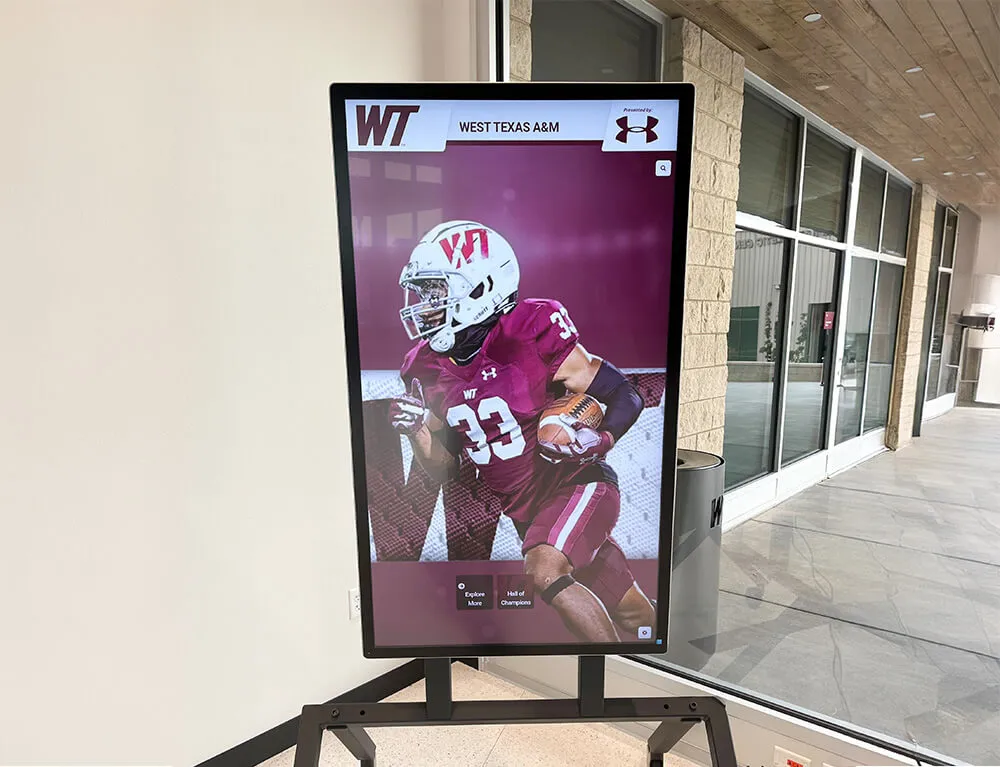
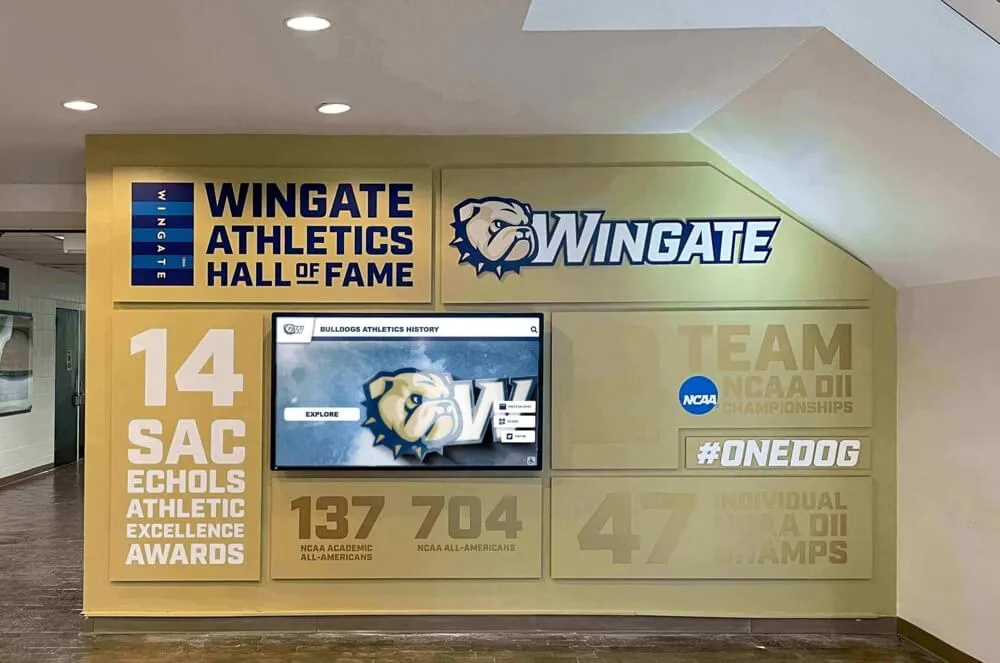
A school’s new 4K recognition display arrives, the hall of fame content is loaded—and the athlete photos look soft, the championship text is slightly blurry, and the historic video frames appear smeared compared to how they look on the editing workstation. The display is on and connected. The resolution reads correctly in Windows. But one thing has gone unchecked: whether the source output and the display panel are operating at a true 1:1 pixel mapping, or whether scaling, overscan, or an intermediate device is silently degrading every image before it reaches the screen.
For a school wall of fame, digital trophy case, or athletic recognition kiosk, image quality is not cosmetic—it is the difference between a display that honors athletes and donors with the sharpness their records deserve, and one that looks like a compromise. Championship banners, inductee portraits, archived team photographs, record-board graphics, and school record graphics all depend on accurate pixel delivery from the source device through every device in the signal path to the panel.
This recognition display pixel mapping checklist gives school IT coordinators, AV technicians, athletic directors, and recognition-program owners a structured, phase-by-phase workflow to verify and enforce 1:1 pixel mapping on every recognition screen—from a single lobby kiosk to a multi-building campus deployment.
Nothing in this article constitutes legal or safety advice. Follow district IT change management procedures and manufacturer guidance before modifying display firmware, GPU driver settings, or signal-path hardware.
Pixel mapping on a recognition display means the source device outputs a signal at the display’s exact native resolution, the display panel renders each incoming pixel without scaling or overscan, and no intermediate device in the signal path resamples or crops the image. The result is that every pixel the content creator placed in the graphic or video arrives at the panel unchanged—no interpolation artifacts, no edge cropping, no softness from a non-native scale factor. The checklist table and phase walkthroughs below verify every step of that chain.
What 1:1 Pixel Mapping Means for Recognition Displays
A modern recognition display panel has a fixed physical pixel grid. A 4K panel has 3,840 columns and 2,160 rows of pixels. A 1080p panel has 1,920 columns and 1,080 rows. 1:1 pixel mapping means the source sends exactly that many pixels and the display renders each one without modification. No pixel is doubled. No pixel is averaged with its neighbors. No row or column is discarded as overscan.
When 1:1 mapping is not in effect, one of several conditions is active:
| Scaling Condition | What the Display Does | Visible Result |
|---|---|---|
| Source outputs lower resolution than native | Display scales up using bilinear or bicubic algorithm | Soft image, blurred text edges, smeared fine detail |
| Overscan enabled | Display crops 5–10% of all edges and scales the remaining image to fill the panel | Athlete names clipped at edges; image appears zoomed and soft |
| Intermediate scaler in signal path | External processor resamples image before it reaches the display | Double scaling artifacts; moiré on fine patterns; color banding |
| Source outputs at a non-native aspect ratio | Display adds letterbox/pillarbox bars or stretches to fill | Distorted silhouettes; stretched school graphics |
| Display in “zoom” or “wide” picture mode | Display’s picture size setting crops and scales | Same as overscan—clipped edges and softness |
Whether the display is showing athletic records, award ceremony programs and hall of fame inductee profiles, or team achievement recognition content, any of these conditions reduces the professionalism of the final presentation. A pixel-mapping checklist catches all of them before a ceremony or open house reveals them first.
Recognition Display Pixel Mapping: Master Checklist
Use this table as your working document for each recognition display. Assign items to responsible team members before starting and store a completed copy in the display’s installation record.
| Checklist Item | Phase | Owner | Status | Review Trigger |
|---|---|---|---|---|
| Document display native resolution and panel size | Preparation | IT Coordinator | ☐ Pending | Before every new deployment |
| Document source device GPU model and driver version | Preparation | IT Coordinator | ☐ Pending | Before every new deployment |
| Confirm source output resolution matches display native resolution exactly | Phase 1 | IT Coordinator | ☐ Pending | After any OS or driver update |
| Confirm source refresh rate matches display preferred refresh rate | Phase 1 | IT Coordinator | ☐ Pending | After any OS or driver update |
| Confirm color depth set to 8-bit or 10-bit as specified by display manufacturer | Phase 1 | IT Coordinator | ☐ Pending | After any GPU driver update |
| Confirm color range set to Full RGB (0–255) for non-broadcast recognition displays | Phase 1 | IT Coordinator | ☐ Pending | After any GPU driver update |
| Disable overscan in GPU driver display settings | Phase 2 | IT Coordinator | ☐ Pending | After any GPU driver update |
| Verify no “zoom,” “aspect,” or “wide” mode is active in GPU control panel | Phase 2 | IT Coordinator | ☐ Pending | After any GPU driver update |
| Set display picture size mode to “Just Scan,” “Dot by Dot,” “1:1,” or “Full Pixel” | Phase 3 | AV Technician | ☐ Pending | After any display firmware update |
| Disable display-side overscan in picture size menu | Phase 3 | AV Technician | ☐ Pending | After any display firmware update |
| Confirm no sharpness enhancement or super-resolution processing is active on the display | Phase 3 | AV Technician | ☐ Pending | After any picture mode change |
| Confirm motion smoothing is disabled for video content | Phase 3 | AV Technician | ☐ Pending | After any picture mode change |
| Confirm signal path contains no non-bypass scalers | Phase 4 | AV Technician | ☐ Pending | After any signal path change |
| Verify extender or matrix switch passes signal at native resolution without resampling | Phase 4 | AV Technician | ☐ Pending | After any extender firmware update |
| Run a full-field native-resolution test pattern from the source | Phase 5 | AV Technician | ☐ Pending | After any configuration change |
| Verify 1-pixel checkerboard pattern appears as uniform gray at all corners and center | Phase 5 | AV Technician | ☐ Pending | After any configuration change |
| Verify fine text (10px and 12px font) is fully sharp in a native-resolution test image | Phase 5 | AV Technician | ☐ Pending | After any configuration change |
| Verify no edge clipping on full-field boundary test pattern | Phase 5 | AV Technician | ☐ Pending | After any overscan-related change |
| Confirm athlete portraits are sharp at full profile size | Phase 6 | Recognition Program Owner | ☐ Pending | Before every ceremony or event |
| Confirm championship video plays without interpolation artifacts or color banding | Phase 6 | Recognition Program Owner | ☐ Pending | Before every ceremony or event |
| Confirm record-board and award-text graphics are fully legible at viewer distance | Phase 6 | Recognition Program Owner | ☐ Pending | Before every ceremony or event |
| Document confirmed pixel mapping settings in display installation record | Documentation | IT Coordinator | ☐ Pending | After validation passes |
| Schedule annual pixel mapping review aligned with GPU and display firmware update cycle | Documentation | IT Coordinator | ☐ Pending | Annually |
Before You Start: Prerequisites
Gather Device Specifications
Effective pixel mapping verification starts with knowing the exact specifications of both endpoints: the source device that generates the image and the display panel that renders it.
For each recognition display in your inventory, record:
| Field | Example Values |
|---|---|
| Device name / asset tag | KIOSK-HALL-OF-FAME-01 |
| Physical location | Athletics lobby, east wall |
| Display manufacturer and model | Samsung QM55B |
| Display native resolution | 3840×2160 (4K UHD) |
| Display preferred refresh rate | 60 Hz |
| Source device OS and GPU | Windows 11 Pro, NVIDIA T400 |
| GPU driver version | 546.33 |
| Signal path devices | None / AV extender / matrix switch |
| Cable type and length | HDMI 2.0, 8 ft |
This record is your reference throughout the checklist. It prevents the common scenario where an IT technician sets the source to 3840×2160 on a 1080p panel and cannot understand why the image still looks wrong—the native resolution of the display must be known before any setting is applied.
Identify the Display’s Pixel-Mapping Mode Name
Display manufacturers use different names for the mode that disables all scaling and overscan. Locate the correct name for your panel before opening the on-screen display menu:
| Manufacturer | Pixel-Mapping Mode Name |
|---|---|
| Samsung (commercial) | “Just Scan” |
| LG (commercial) | “Just Scan” or “1:1” |
| Sony (professional) | “Full Pixel” or “Dot by Dot” |
| NEC / Sharp NEC | “Overscan Off” |
| Panasonic | “H-Fill” then overscan disabled |
| ViewSonic | “Full” with overscan disabled |
| Generic / Unbranded | Check “Picture Size,” “Aspect Ratio,” or “Zoom” settings for a “1:1” or “Off” option |
Stakeholder Alignment
| Decision | Owner |
|---|---|
| Display native resolution per device | IT Coordinator and AV Technician |
| GPU driver update authority | Network / Systems Administrator |
| Display OSD access and picture mode authority | AV Technician or Facilities |
| Recognition content quality sign-off | Athletic Director or Recognition Program Owner |
| Configuration documentation repository | IT Asset Manager |
Phase 1: Configure the Source Device Output Resolution
The first step in achieving 1:1 pixel mapping is ensuring the source device outputs a signal that exactly matches the display’s native resolution—no more, no less.
Step 1.1 — Set the Output Resolution to Native
Windows (NVIDIA GPU):
- Right-click the desktop and open Display settings.
- Under Resolution, select the display’s native resolution (for example, 3840×2160 for a 4K panel or 1920×1080 for a 1080p panel).
- Click Keep changes when prompted.
- Open NVIDIA Control Panel → Display → Change Resolution.
- Confirm the resolution and refresh rate match the display’s native specification. If the panel supports 60 Hz natively, set the refresh rate to 60 Hz—not 59.94 Hz, which can cause subtle timing mismatches on some commercial panels.
Windows (Intel Arc / Intel UHD):
- Open Intel Graphics Command Center → Display.
- Set Resolution to native and Refresh Rate to the display’s preferred value.
- Under Advanced → Scaling, set to Maintain Display Scaling to preserve the display’s geometry; overscan is addressed separately in Phase 2.
Windows (AMD Radeon):
- Open AMD Software: Adrenalin Edition → Display.
- Use Custom Resolution if the native option is absent from the standard dropdown.
- Under Display Color, verify the pixel format matches the display’s preferred input format.
Step 1.2 — Set Color Depth and Color Range
Two settings that are frequently overlooked but affect pixel-level accuracy:
Color depth: Set to 8-bit unless the display is a verified 10-bit professional panel and the entire content pipeline is 10-bit end-to-end. A bit-depth mismatch causes banding in gradient-heavy recognition graphics such as championship banners and branded award layouts.
Color range / pixel format:
- Set to Full RGB (0–255) for recognition kiosks connected to commercial displays that expect PC input.
- Set to Limited (16–235) only if the display’s input is configured for video range and cannot be changed—an incorrect full/limited mismatch crushes blacks and clips whites in archived video content.
Most commercial recognition displays default to “Auto” for color range detection. Confirm the detected range matches your source setting by checking the display’s signal information screen in the OSD.
Phase 2: Disable Overscan in the GPU Driver
Overscan is the most common cause of pixel mapping failure on recognition displays. Originally introduced in the broadcast television era to hide noise at the edges of analog signals, overscan is meaningless for digital recognition displays—but many GPU drivers and commercial displays enable it by default when they detect an HDMI connection.
With overscan enabled: the source scales the image up by approximately 5–10% and transmits a cropped center region. The display receives a signal that appears to fill the panel, but the actual image has been zoomed in—every pixel is upscaled from a smaller source, producing softness across the entire frame and clipping content at all four edges.
Step 2.1 — Disable Overscan in the NVIDIA Control Panel
- Open NVIDIA Control Panel → Display → Adjust Desktop Size and Position.
- In the Scaling section, select No Scaling.
- If an overscan slider is visible (common on HDMI-connected commercial displays in older driver versions), drag it to 0% overscan.
- Apply the settings.
Step 2.2 — Disable Overscan in AMD Radeon Software
- Open AMD Software → Display → Image Scaling.
- Ensure GPU Scaling is disabled or the overscan value is 0%.
- In the Display Color section, confirm no overscan percentage is applied.
Step 2.3 — Disable Overscan in Intel Graphics Command Center
- Open Intel Graphics Command Center → Display → General.
- Under Scaling, select Maintain Aspect Ratio or Do Not Scale—not “Scale Full Screen,” which can apply overscan to fill the panel.
- Confirm the image boundary aligns with the display’s full panel area using the boundary test pattern in Phase 5.
Phase 3: Set the Display’s Pixel-Mapping Picture Mode
Even when the source outputs a perfect native-resolution signal with no GPU overscan, the display itself may silently scale, crop, or enhance the image through its own picture size and processing settings.
Step 3.1 — Enter the Display’s Picture Size or Aspect Ratio Menu
Access the display’s on-screen display (OSD) via the remote control or the physical menu buttons:
- Navigate to Picture → Picture Size, Aspect Ratio, or Display → Zoom Level (exact path varies by manufacturer).
- Select the pixel-mapping mode identified in the prerequisites (Just Scan, Dot by Dot, 1:1, Full Pixel, or equivalent).
- Confirm no overscan percentage appears in the setting details.
What to avoid in this menu:
- “16:9 Zoom” or “Wide” — crops horizontal edges
- “4:3 Expand” — letterboxes and scales horizontally
- “Auto” — can switch modes based on signal detection, causing inconsistent behavior across power cycles
- Any zoom percentage above 100%
Step 3.2 — Disable Display-Side Sharpness Enhancement
Most commercial displays include sharpness, detail enhancement, or super-resolution processing that sharpens perceived edges by adding artificial contrast—but also creates ringing artifacts and haloing around fine typography and jersey numbers. For digital hall of fame displays presenting athlete profiles and awards text at close viewing distance, artificial sharpening often makes text harder to read rather than easier.
- Navigate to Picture → Expert Settings or Picture → Advanced.
- Set Sharpness to 0 or the minimum value.
- Disable any setting labeled Super Resolution, HyperReal Engine, Edge Enhancement, Clarity, or equivalent.
- Disable Motion Smoothing or Auto Motion Plus for video content—this setting adds interpolated frames that are visually distinct and inappropriate for archived athletic footage.
Step 3.3 — Disable Display-Side Overscan If Listed Separately
Some commercial displays have an overscan toggle independent of the picture size mode:
- Navigate to Picture → Picture Options or Signal Calibration → Overscan.
- Set Overscan to Off.
- Confirm this setting does not reset when the input signal changes or when the display is power-cycled.
Phase 4: Audit the Signal Path for Intermediate Scaling
Every device between the source GPU output and the display panel is an opportunity for unintended resampling. AV extenders, matrix switches, splitters, and signal processors each have their own scaling behavior that must be verified.
Step 4.1 — Map Every Device in the Signal Path
Draw or describe the complete path from source GPU output to display panel input:
| Position | Device | Model | Firmware Version | Scaling Mode Setting |
|---|---|---|---|---|
| 1 | Source GPU output | NVIDIA T400, HDMI port 1 | Driver 546.33 | Native 3840×2160 |
| 2 | HDMI cable | Passive HDMI 2.0, 8 ft | N/A | N/A |
| 3 | AV extender (transmitter) | Kramer EXT3-U-HU-SET | 2.6 | Pass-through |
| 4 | AV extender (receiver) | Kramer EXT3-U-HU-SET | 2.6 | Pass-through |
| 5 | Display input | Samsung QM55B, HDMI 1 | 1006.1 | — |
For any device appearing in positions 2–4, verify the following.
Step 4.2 — Verify AV Extender Pass-Through Mode
AV extenders—used in recognition display installations where the source PC is in a rack room or closet and the display is on the lobby wall—must be configured to pass the signal at native resolution without resampling:
- Access the extender’s web management interface, front-panel button menu, or PC configuration utility.
- Locate the Output Resolution or Signal Mode setting.
- Set it to Auto or Pass-Through—not a fixed resolution such as 1080p, which would force downscaling of a 4K source signal.
- Confirm the extender’s maximum bandwidth supports the required signal: 4K/60Hz at 4:4:4 color requires an extender rated for HDMI 2.0 (18 Gbps) or higher.
- Verify the firmware is current—older extender firmware sometimes defaults to a fixed output resolution that overrides pass-through mode after a power cycle.
Step 4.3 — Check Matrix Switch Port Configuration
Matrix switches used in multi-screen recognition installations—one source PC feeding multiple display locations—can independently scale each output port:
- Access the matrix switch management interface.
- For each port connected to a recognition display, verify the output resolution matches that display’s native resolution, or is set to pass-through if all connected displays share the same native resolution.
- Confirm no upscaling or downscaling is applied at the switch level.
A recognition display installation running historic game footage and championship documentation alongside athlete profiles depends on every device in the signal path maintaining the source resolution. Booster clubs and athletic program supporters who fund recognition display upgrades expect the content to look as sharp as the hardware specifications promise—a misconfigured extender or matrix port silently undermines that investment.
Phase 5: Run Test Patterns to Verify 1:1 Pixel Mapping
Test patterns are the objective verification step. No amount of visual inspection of normal content confirms 1:1 pixel mapping as definitively as a properly selected test pattern at native resolution.
Step 5.1 — Select and Generate Test Patterns at Native Resolution
Test patterns must be generated at the display’s exact native resolution to be meaningful. A 1080p test pattern displayed on a 4K screen will always be upscaled—using a wrong-resolution test pattern produces false results.
Recommended test patterns for recognition display verification:
| Pattern | What It Tests | What to Look For |
|---|---|---|
| 1-pixel checkerboard (alternating black/white pixels) | Pixel mapping accuracy | Appears as uniform medium gray — any visible grid or moiré indicates scaling |
| Sharpness / resolution test chart | Fine detail rendering | Finest lines cleanly resolved — blurring at any ring indicates scaling |
| Full-field boundary test | Overscan detection | All four corner markers fully visible — any clipping indicates active overscan |
| Grayscale ramp (0–255) | Color range detection | Steps 0 and 255 both visible — crushed blacks or clipped whites indicate wrong color range |
| Red, green, blue full-field patterns | Color accuracy baseline | Each solid-field saturated and uniform — banding indicates bit-depth or dithering issues |
| Fine typography (10px sans-serif text) | Text rendering for awards and records | Text fully legible at normal viewing distance — blurring indicates sub-pixel rendering loss from scaling |
Free test pattern tools:
- DisplayCAL (open source): Generate patterns at any native resolution
- Windows Display Color Calibration (
dccwfrom a command prompt): Includes a basic sharpness verification step - VLC media player: Play a native-resolution test pattern video file for video content verification
Step 5.2 — Verify the 1-Pixel Checkerboard Pattern
The 1-pixel alternating checkerboard at native resolution is the single most definitive test for 1:1 pixel mapping:
- Generate or load a 1-pixel checkerboard at the display’s exact native resolution (for example, a 3840×2160 PNG with alternating black and white pixels in a true checkerboard grid).
- Display it full-screen with no scaling applied in the viewing application.
- Stand at the intended viewer distance and inspect the result:
- Correct 1:1 mapping: The pattern appears as a uniform medium gray, since individual pixels are below the eye’s resolution at viewing distance. The field is smooth and even with no visible grid or interference pattern.
- Scaling is active: The pattern shows visible bands, grids, moiré, or dark/light striping because the scaler is averaging pixels unevenly.
- Inspect all four corners and the center—scaling artifacts from an undersized source or partial overscan appear most clearly at the edges.
Step 5.3 — Verify the Boundary Test for Overscan
- Load a full-field boundary test pattern that places a distinct color marker at each corner and a thin border line around the full perimeter of the native resolution image.
- Display it full-screen.
- Verify all four corner markers are fully visible.
- Verify the border line is uninterrupted on all four sides—top, bottom, left, and right.
- If any marker or edge is clipped, overscan is still active somewhere in the signal path or display settings. Return to Phase 2 or Phase 3 and re-verify those settings.
Step 5.4 — Test Fine Typography Rendering
Load a test image containing text at 10px and 12px sizes in a sans-serif font at native resolution:
- Text at these sizes should be readable with no blurring on a correctly pixel-mapped display.
- Sub-pixel fringing in red, green, or blue indicates the display is applying its own text processing in addition to the GPU’s ClearType—check whether the display’s “Super Resolution” or sharpness enhancement was fully disabled in Phase 3 Step 3.2.
School recognition content relies heavily on fine typography: inductee years, championship records, award categories, and donor names often appear at small sizes on complex layouts. Athletic archive metadata standards recommend exporting recognition graphics at exact display-native resolution specifically to avoid scaling-induced text degradation during archival and display workflows.
Phase 6: Validate Recognition Content
After test patterns confirm pixel mapping, validate the actual recognition content under the conditions it will be presented.
Step 6.1 — Athlete Portrait and Profile Verification
- Load the recognition platform with a representative athlete profile that includes a full-resolution portrait photograph and detailed statistics.
- Stand at the intended viewer distance (typically 4–8 feet for a lobby kiosk, 8–15 feet for a hallway display).
- Verify:
- Portrait photography is sharp with no visible softness or ringing around face and hair edges
- Jersey numbers and statistical text is fully legible
- School colors render accurately without banding or color shifts at the edges of graphics
For recognition programs that feature photography from multiple decades, archived images vary significantly in original resolution. Flag any image that appears soft—it may be a genuinely low-resolution historical photo rather than a pixel mapping failure. The test is whether the image appears as sharp as the source file, not whether the source file itself is high resolution.
Step 6.2 — Championship Video Playback Verification
- Play a sample video clip at the display’s native resolution (a 3840×2160 video on a 4K display, or a 1920×1080 video on a 1080p display).
- Verify:
- Motion appears natural without soap-opera smoothing (confirms motion smoothing was disabled in Phase 3)
- Fine detail in sports action footage is resolved correctly—jersey fabric texture, scoreboard text, crowd signage
- Transitions between cuts are clean with no blocking or banding artifacts
- Color in game footage matches the source as viewed on the editing workstation (confirms correct color range setting from Phase 1)
Championship trophy display programs that include video highlights alongside physical trophy showcases and digital inductee profiles depend on video rendering quality that reflects the effort invested in capturing and producing that footage. A pixel mapping failure in video is immediately visible during a ceremony.
Step 6.3 — Award Graphics and Record Board Rendering
School recognition programs often include custom graphics: all-conference award certificates, scoring record boards, and state championship banners. Verify each graphic type in production:
- Display each graphic at full screen.
- Confirm no text is clipped at any edge—clipping indicates residual overscan.
- Confirm thin horizontal and vertical lines in graphic layouts (table borders, underlines, separating rules) appear as single crisp lines, not blurry two-pixel bands.
- Confirm school brand colors match the approved color palette as viewed on a calibrated reference monitor.
Pixel Mapping Quick-Reference: Symptom-to-Cause Table
| Symptom | Most Likely Cause | Phase to Check |
|---|---|---|
| Soft, blurry overall image | Overscan active at GPU or display level | Phase 2 and Phase 3 |
| Text slightly blurry; photos sharp | Display sharpness enhancement adding ringing | Phase 3 Step 3.2 |
| Edge content clipped; image appears zoomed | Overscan still active | Phase 2, Phase 3, Phase 5.3 |
| Moiré or interference pattern on fine grids | Source not at native resolution; scaling active | Phase 1 and Phase 4 |
| Blacks look gray; whites are clipped | Color range mismatch (full vs. limited) | Phase 1 Step 1.2 |
| Video has soap-opera motion effect | Motion smoothing enabled on display | Phase 3 Step 3.2 |
| Sharp on direct cable; soft through extender | Extender downscaling or resampling active | Phase 4 |
| Correct in center; soft at edges | Display overscan compensation scaling | Phase 3 Step 3.1 |
Frequently Asked Questions
What is pixel mapping on a recognition display?
Pixel mapping (also called 1:1 pixel mapping or dot-by-dot mode) is the operating state in which the source device outputs a signal at the display’s exact native resolution and the display renders each incoming pixel without scaling, cropping, or interpolation. Every pixel in the source image arrives at exactly one physical pixel on the panel. The result is the sharpest possible image the display can render. For school recognition displays, this matters because athlete portraits, championship graphics, and award typography all contain fine detail that scaling algorithms cannot preserve completely.
Why do GPU drivers add overscan by default on HDMI connections?
GPU manufacturers defaulted to overscan on HDMI connections because HDMI was originally used for consumer televisions, which historically cropped the signal edges under the assumption that broadcast signals contained noise in those areas. Recognition displays are not broadcast televisions—they receive a clean digital signal from a PC—so overscan serves no purpose and should always be disabled. The default persists because driver teams apply conservative settings that avoid blank-edge complaints from TV-connected users, even though those defaults degrade image quality for any PC-connected commercial display.
What is the difference between “Just Scan,” “Dot by Dot,” and “Full Pixel” on commercial displays?
These are manufacturer-specific names for the same underlying feature: a picture size mode that disables all scaling and overscan, rendering the incoming signal at exactly the panel’s native resolution. Samsung uses “Just Scan,” Sony uses “Dot by Dot” or “Full Pixel,” LG uses “Just Scan” or “1:1,” and NEC uses the overscan-off setting. The behavior is identical regardless of the name. Confirm the mode is actually producing 1:1 output by running the 1-pixel checkerboard test pattern and the full-field boundary test after selecting it.
Can I confirm 1:1 pixel mapping without specialized test pattern software?
Yes, at a basic level. Display the smallest text you can generate (10–12px sans-serif in an image editor) at the display’s native resolution, set it full-screen, and view it at the intended viewer distance. If the text is fully legible, pixel mapping is likely active. For definitive verification, the 1-pixel checkerboard test is the most reliable single test. DisplayCAL (open source) generates the required patterns at any native resolution without cost.
Does pixel mapping affect touchscreen calibration on recognition kiosks?
No—pixel mapping is about the image rendered on the panel, not the touch input coordinate system. Touch calibration is a separate procedure that maps the touchscreen controller’s coordinate space to the display’s physical pixel grid. However, if overscan was previously active and a display was calibrated in that state, disabling overscan changes the rendered image boundary, which may cause a mismatch between where the user taps and where the interface responds. Re-run touchscreen calibration after any pixel mapping change.
How often should we reverify pixel mapping on a school recognition display?
Verify pixel mapping after any GPU driver update, any display firmware update, any change to signal path hardware, and any OS reinstall. GPU driver updates are the most common cause of overscan settings reverting to their defaults. Incorporate pixel mapping verification into the same post-update display testing checklist used for EDID and orientation settings. For displays that run without frequent changes, an annual review aligned with the district’s technology update cycle is sufficient.
What causes an intermittent blur on an otherwise sharp recognition display?
If the display appears sharp on some content and blurry on others, the most common cause is the source content itself—low-resolution historical photographs being displayed at a size larger than their original pixel dimensions. This is not a pixel mapping failure; it is a content resolution issue. Verify by displaying a known native-resolution test image: if it is sharp while the historical photo is blurry, the image source is the cause. Encourage the recognition program administrator to source the highest available resolution versions of archival photos, and document which images are resolution-limited so future content updates can prioritize replacing them.
Want a Recognition Display That Looks Sharp from Day One?
Rocket Alumni Solutions builds and supports touchscreen walls of fame, digital trophy cases, donor recognition displays, and athletic history exhibits for schools. Every deployment includes signal path documentation, display configuration specifications, and the content requirements your AV team needs to maintain pixel-perfect output across the full lifecycle of the hardware. Schedule a walkthrough to see the platform in action.
Schedule a Free TouchWall DemoConclusion
A recognition display that is not pixel-mapped is delivering a subtly degraded image to every student, alumni, and visitor who views it—and because the degradation is uniform across the frame, it often goes unnoticed until a side-by-side comparison reveals how much sharpness has been lost. Working through this checklist takes one technician one to two hours per display, and the result is an image that fully honors the athletes, donors, and achievements the display exists to celebrate. Verify the source output resolution, disable overscan at both the GPU and display layers, set the display’s pixel-mapping picture mode, audit every device in the signal path, run the test patterns, and validate with real recognition content. Document the confirmed settings in the display’s installation record and revisit them after every major software update. The sharpness of the final image is not a matter of having expensive hardware—it is a matter of configuring the hardware you have correctly, from signal origin to panel.