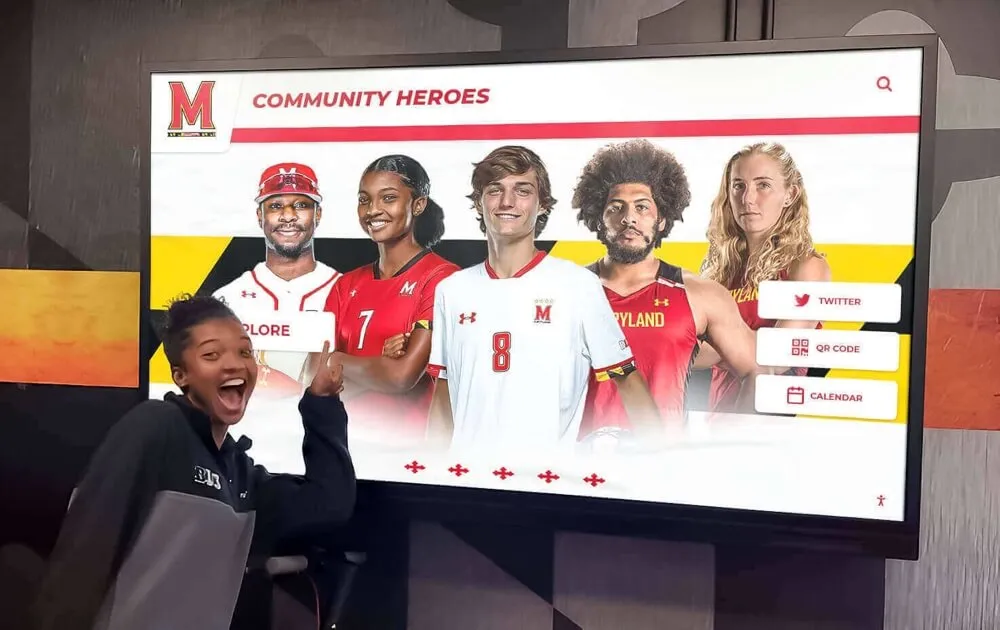
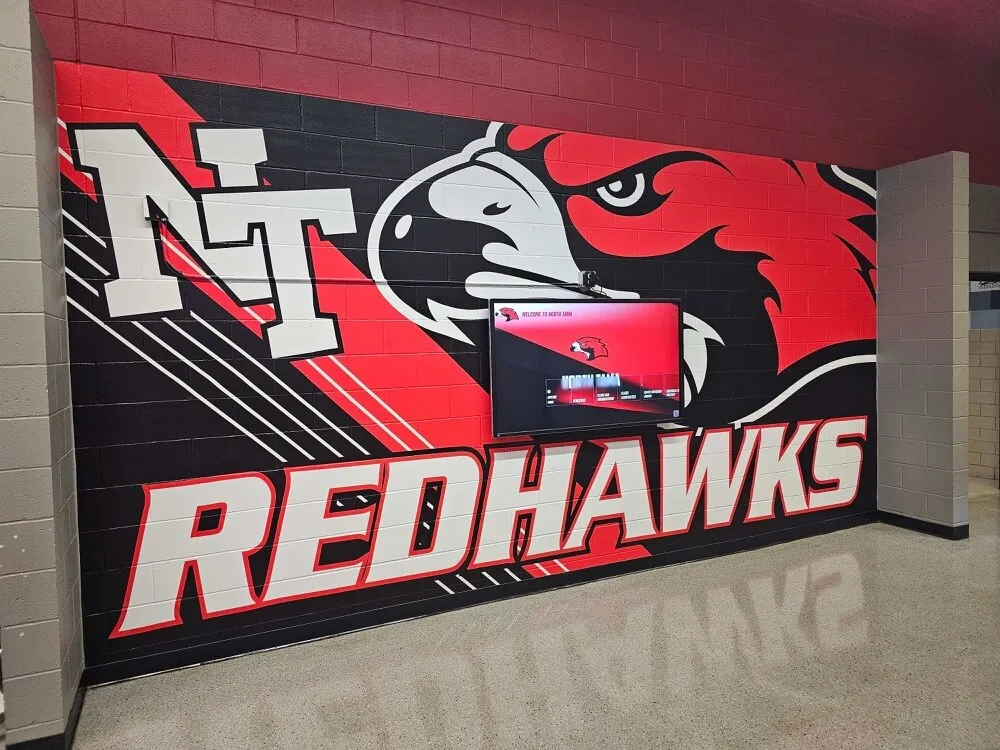
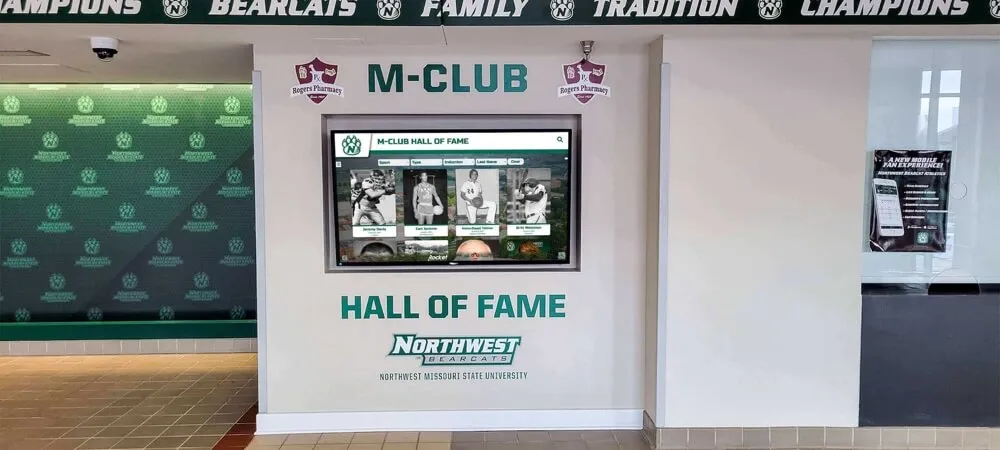
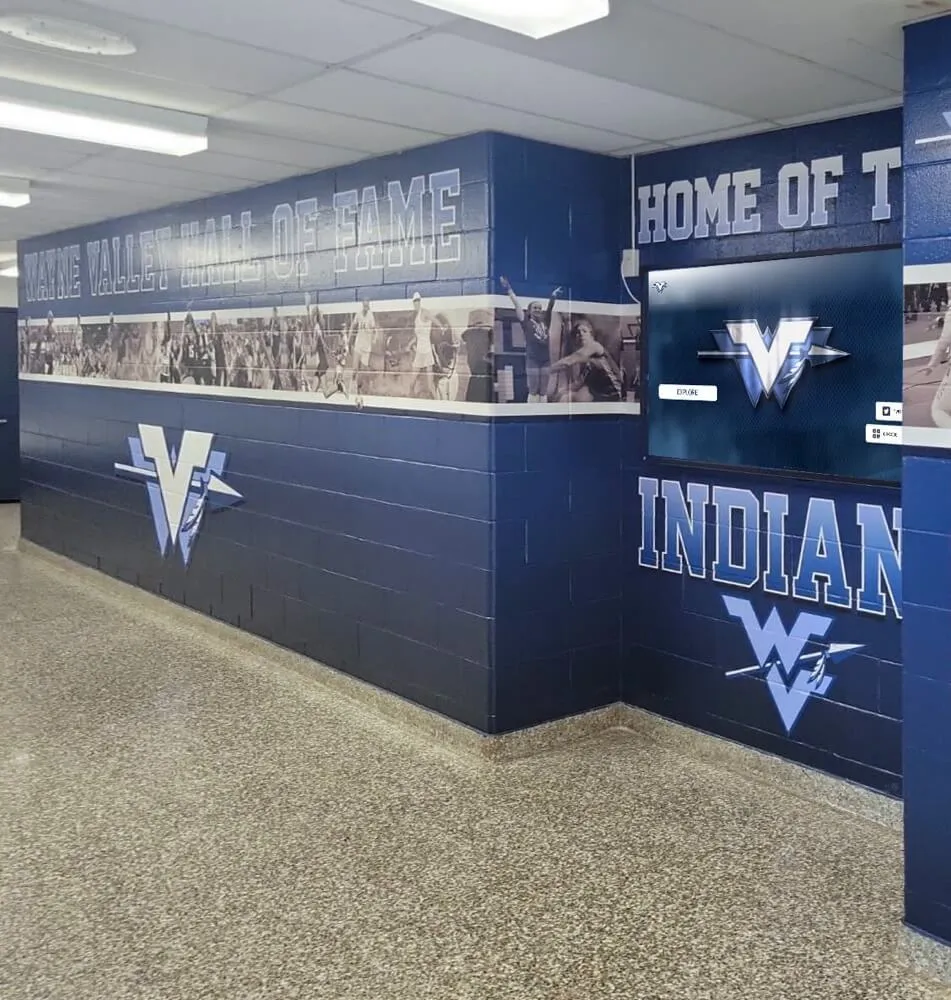
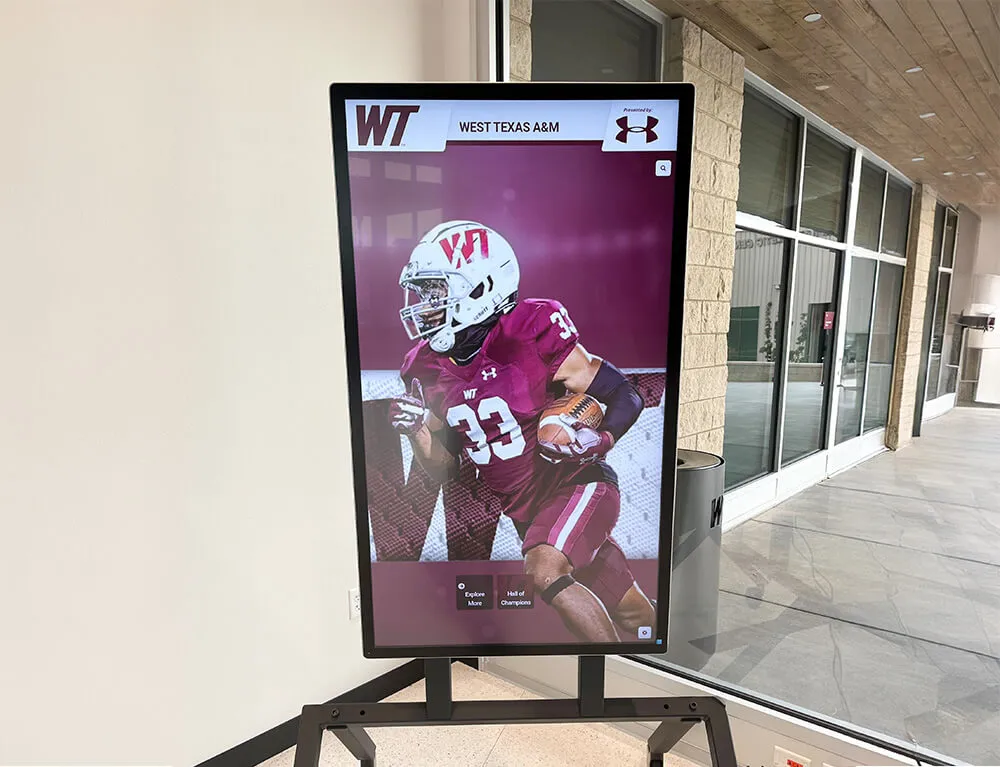
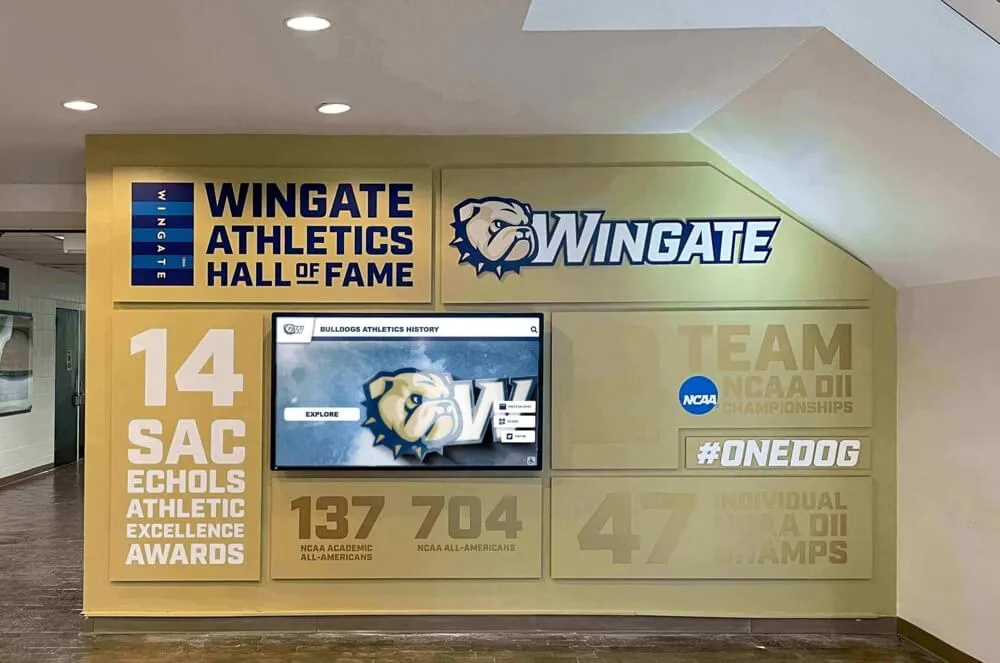
Recognition display SNMP monitoring is the practice of querying your hall of fame kiosks, lobby touchscreens, and donor wall displays over the Simple Network Management Protocol — collecting uptime counters, interface statistics, CPU and memory utilization, disk capacity, and hardware temperature — and routing those metrics to a centralized alerting system before a device fails in front of an audience.
Without it, the only way to know a recognition display has gone offline is to walk past it or receive a complaint from an athletic director minutes before the ceremony starts. With it, your network monitoring system flags a device that stopped responding at 3 a.m., an interface that accumulated excessive errors overnight, or a CPU temperature trending toward thermal throttle — and your team fixes the issue before anyone in the building notices.
This guide walks school IT coordinators, network administrators, and facilities staff through the complete recognition display SNMP monitoring workflow: enabling agents, selecting OIDs, setting thresholds, and building an alert structure that matches the operational reality of a school technology team.
Nothing in this article constitutes network security or legal advice. Schools subject to CIPA, FERPA, or district cybersecurity policies should involve qualified IT leadership and legal counsel when designing network monitoring infrastructure.
The direct answer: add each recognition display to your network monitoring system as an SNMP-polled endpoint, configure the standard host-resources MIB for CPU, memory, disk, and uptime, add interface statistics from the standard MIB-II interfaces group, set temperature thresholds if the hardware exposes them via the HOST-RESOURCES-MIB or a vendor MIB, and define notification rules that page your helpdesk when any metric crosses its threshold. The sections below walk through every step.
Why SNMP Fits Recognition Display Infrastructure
SNMP is a network industry standard supported on Windows, Linux, and most embedded appliance platforms without additional licensing. Every major network monitoring system — LibreNMS, Zabbix, PRTG, Nagios, Icinga — can poll SNMP endpoints and trigger alerts natively. For school IT teams that already run an NMS for network switches and servers, adding recognition displays requires only an agent enablement step on each device and a new host entry in the monitoring system.
Recognition displays have specific operational characteristics that make SNMP particularly useful:
Unattended, continuous operation. Lobby kiosks and hallway touchscreens run 12 to 18 hours per day with no local operator. SNMP polling provides the eyes-on visibility that a continuously staffed terminal would otherwise supply.
High-visibility failure consequences. A recognition display that goes dark during a championship ceremony, a graduation walkthrough, or a donor-recognition event creates a visible gap in a program that your school has invested significant resources to build. Award and recognition programs supported by donor dedication plaques depend on reliable infrastructure to deliver the moment of recognition — SNMP alerts give IT teams a chance to intervene before the audience arrives.
Distributed, multi-building deployments. Schools with display devices in athletics hallways, administrative lobbies, and library entrance areas cannot physically check each unit daily. SNMP monitoring centralizes status across every location into a single dashboard.
Long time between service visits. Recognition display hardware is typically serviced once or twice per semester. SNMP trending data fills the gap — identifying a disk that is 85 percent full three weeks before it would have caused a storage failure, or a CPU that runs hotter than baseline every afternoon due to HVAC shutoff patterns.
SNMP Monitoring Master Checklist
Complete this table for each recognition display before beginning agent configuration. Store the completed document in your IT asset inventory alongside the device’s configuration baseline.
| Item | Verification Method | Expected Result | Review Frequency |
|---|---|---|---|
| SNMP agent installed and running | Get-Service SNMP (Windows) or systemctl status snmpd (Linux) | Service running, startup type Automatic | After every OS update |
| SNMP version in use documented | Agent configuration file or WMI query | v2c (community string) or v3 (auth/priv credentials) — never v1 in production | At commissioning |
| Community string or v3 credentials stored in NMS | NMS device record | Credentials present and tested with a live poll | At commissioning |
| UDP 161 permitted inbound on display device | Host firewall rule review | Rule present for source = NMS IP | After every firewall change |
| UDP 162 permitted outbound to NMS (traps) | Host firewall rule review | Rule present if trap-based alerting is used | After every firewall change |
| NMS can reach device: SNMP walk returns data | snmpwalk -v2c -c <community> <device-ip> .1 | Multiple OID lines returned, no timeout | At commissioning |
| sysUpTime OID polled and graphed | NMS host record → uptime graph | Continuous uptime counter visible; resets detected | After NMS agent addition |
| CPU utilization OID polled | NMS host record → CPU graph | Values populated; alert threshold set | After NMS agent addition |
| Memory utilization OID polled | NMS host record → memory graph | Values populated; alert threshold set | After NMS agent addition |
| Disk utilization OID polled | NMS host record → disk graph | Values for all relevant volumes; alert threshold set | After NMS agent addition |
| Interface statistics polled (ifInErrors, ifOutErrors) | NMS host record → interface graph | Error counters near zero under normal operation | After NMS agent addition |
| Temperature OID polled (if hardware exposes it) | NMS host record → temperature graph | Values present; alert threshold set per vendor spec | After NMS agent addition |
| Alert notification rules configured | NMS alert policy screen | On-call contact receives test alert | After NMS agent addition |
| Polling interval set to 5 minutes or less | NMS host polling settings | 60–300 seconds per poll cycle | After NMS agent addition |
| Alert suppression window defined for maintenance | NMS maintenance schedule | Downtime windows prevent false alerts during scheduled reboots | Before each maintenance window |
| All display devices appear on NMS dashboard | NMS device list | Every display listed, all showing green/normal at baseline | Quarterly |
Before You Start: Prerequisites
Network Access Planning
SNMP uses UDP port 161 for manager-to-agent queries and UDP port 162 for agent-to-manager traps. Before configuring any device, verify that your network perimeter and VLAN firewall rules permit:
- Inbound UDP 161 to the display device IP from the NMS server IP
- Outbound UDP 162 from the display device IP to the NMS server IP (if you use trap-based alerting)
If your recognition displays are on a dedicated AV or IoT VLAN — which is a recommended isolation practice — confirm the inter-VLAN routing permits these specific ports from the NMS VLAN to the display VLAN. Do not open broad inter-VLAN routes for monitoring; create targeted firewall rules scoped to the NMS server IP and the display VLAN subnet.
SNMP Version Selection
| SNMP Version | Authentication | Encryption | School Network Use Case |
|---|---|---|---|
| v1 | Community string, cleartext | None | Not recommended — no security |
| v2c | Community string, cleartext | None | Acceptable on isolated AV VLANs with ACL restrictions; use a unique non-default community string |
| v3 | Username + auth password (MD5/SHA) | Optional (AES/DES) | Recommended for any display on a shared or routable VLAN |
For most school deployments, SNMPv2c with a non-default community string and a source-restricted ACL on the NMS host is operationally practical and an acceptable security posture on a dedicated display VLAN. SNMPv3 with authentication is recommended if displays share a VLAN with student or guest traffic.
NMS Selection
If your school does not already run a network monitoring system, the following open-source options support SNMP polling without licensing cost:
- LibreNMS — auto-discovers devices, includes built-in templates for common hardware, runs on Linux
- Zabbix — flexible trigger and escalation engine; supports SNMP v1/v2c/v3; steeper learning curve
- Icinga 2 — modular, integrates with existing Nagios plugins; good fit for teams with Nagios familiarity
Commercial options like PRTG and SolarWinds offer GUI-driven setup and vendor hardware templates at licensing cost. Choose based on what your team already knows and what your district infrastructure budget supports.
Stakeholder Alignment
Before beginning, confirm ownership of each decision:
| Decision | Primary Owner |
|---|---|
| Approved SNMP version and community string / v3 credentials | IT Coordinator / Network Administrator |
| NMS server location and access | Network Administrator |
| Alert notification recipients and escalation contacts | IT Coordinator and Administration |
| Maintenance window schedule for alert suppression | IT Coordinator and Facilities |
| Display device inventory (IP, location, model) | IT Coordinator / Asset Manager |
Phase 1: Enable the SNMP Agent on Each Display Device
Windows-Based Display Controllers
Most school recognition kiosk controllers run Windows 10 or 11 as a domain-joined device. The SNMP agent is available as an optional feature.
- Open Settings → Optional Features → Add a Feature. Search for SNMP Feature and install it. On Windows Server editions, add the SNMP Service role via Server Manager.
- Open Services (
services.msc). Locate SNMP Service and set the startup type to Automatic. - Open the SNMP Service Properties → Security tab.
- Under Accepted Community Names, click Add. Set community name to your approved value (not “public”) and rights to READ ONLY.
- Under Accept SNMP Packets From These Hosts, add the IP address of your NMS server. Remove “Accept SNMP packets from any host.”
- Start the SNMP Service.
- Verify: from the NMS server, run
snmpwalk -v2c -c <community> <display-ip> .1.3.6.1.2.1.1and confirm system description data returns.
For SNMPv3 on Windows, configure the SNMP service with the snmputil command or use a third-party agent such as Net-SNMP for Windows, which provides full v3 support with authentication and privacy.
Linux-Based Display Controllers
Linux-based display appliances or mini PCs running Ubuntu, Debian, or similar distributions use the Net-SNMP daemon.
- Install Net-SNMP:
apt install snmpd snmp(Debian/Ubuntu) ordnf install net-snmp net-snmp-utils(RHEL/Rocky). - Edit
/etc/snmp/snmpd.conf. Replace the default community string and restrict access to the NMS IP:
# Replace 'yourCommunity' with your approved community string
# Replace '10.10.10.5' with your NMS server IP
rocommunity yourCommunity 10.10.10.5
For SNMPv3:
createUser monitorUser SHA "authPassword" AES "privPassword"
rouser monitorUser priv
- Enable and start the daemon:
systemctl enable snmpd && systemctl start snmpd. - Open the firewall port:
ufw allow from <NMS-IP> to any port 161 proto udp(UFW) or the equivalent firewall command for your distribution. - Verify:
snmpwalk -v2c -c yourCommunity localhost .1.3.6.1.2.1.1should return system data.
Vendor-Managed Appliances and Dedicated Signage Players
Purpose-built digital signage appliances often expose SNMP configuration through a web-based management console. The configuration path varies by vendor, but the required inputs are the same: SNMP version, community string or v3 credentials, and NMS IP restriction. Consult your appliance documentation or vendor support for the specific configuration screen.
Phase 2: Add Display Devices to the NMS
Adding Hosts in LibreNMS
- Navigate to Devices → Add Device.
- Enter the device hostname or IP address.
- Select SNMP Version (v2c or v3) and enter the community string or v3 credentials.
- Set the Port to 161 and Transport to UDP.
- Click Add Device. LibreNMS will poll the device and auto-discover available MIB modules based on the sysObjectID it returns.
- Assign the device to a Device Group named “Recognition Displays” or “Lobby Kiosks” to enable group-level alerting and reporting.
Adding Hosts in Zabbix
- Navigate to Configuration → Hosts → Create Host.
- Enter the display device IP and hostname. Assign it to a host group (create “Recognition Displays” if it does not exist).
- Under Interfaces, add an SNMP interface with the device IP and port 161.
- Under Templates, link the Template OS Windows SNMP or Template OS Linux SNMP template as appropriate. These include pre-built items for CPU, memory, disk, uptime, and interface statistics.
- Under Macros, set
{$SNMP_COMMUNITY}to your community string value for the host. - Click Add. Zabbix begins polling within the next collection interval (default 1 minute for SNMP items).
Organizing Displays by Location
Create a location-based grouping structure in your NMS from the start. Schools with displays in multiple buildings benefit from a hierarchy such as:
- Recognition Displays
- Athletics Hallway
- Main Lobby
- Library Entrance
- Gymnasium Foyer
This grouping lets you send targeted notifications to the facilities team responsible for a specific building area and filter dashboard views by the physical location most relevant to the current event schedule.
Phase 3: Select OIDs to Poll
Standard SNMP MIBs cover the health metrics most useful for recognition display monitoring. The table below lists the most operationally relevant OIDs with the data they return and the recommended polling interval.
Standard MIB-II and Host-Resources OIDs
| Metric | MIB | OID | Notes |
|---|---|---|---|
| System uptime | MIB-II | .1.3.6.1.2.1.1.3.0 (sysUpTime) | Returns hundredths of seconds since last reboot; alerts on unexpected resets |
| System description | MIB-II | .1.3.6.1.2.1.1.1.0 (sysDescr) | OS name and version; useful for inventory validation |
| Interface operational status | IF-MIB | .1.3.6.1.2.1.2.2.1.8 (ifOperStatus) | 1 = up, 2 = down; alert on value ≠ 1 for the primary interface |
| Interface input errors | IF-MIB | .1.3.6.1.2.1.2.2.1.14 (ifInErrors) | Rising counter; alert when rate exceeds 10 errors/minute |
| Interface output errors | IF-MIB | .1.3.6.1.2.1.2.2.1.20 (ifOutErrors) | Rising counter; alert when rate exceeds 10 errors/minute |
| Interface input octets | IF-MIB | .1.3.6.1.2.1.2.2.1.10 (ifInOctets) | Bandwidth utilization baseline |
| CPU load (1-min avg) | HOST-RESOURCES-MIB | .1.3.6.1.2.1.25.3.3.1.2 (hrProcessorLoad) | Percent; alert when sustained above 90% for 10+ minutes |
| Total physical memory | HOST-RESOURCES-MIB | .1.3.6.1.2.1.25.2.2.0 (hrMemorySize) | Fixed reference value |
| Storage used | HOST-RESOURCES-MIB | .1.3.6.1.2.1.25.2.3.1.6 (hrStorageUsed) | Divide by hrStorageSize for percent; alert at 85% |
| Storage allocation units | HOST-RESOURCES-MIB | .1.3.6.1.2.1.25.2.3.1.4 (hrStorageAllocationUnits) | Required for byte calculation |
| Running processes count | HOST-RESOURCES-MIB | .1.3.6.1.2.1.25.4.2.1.2 (hrSWRunName) | Table walk; confirm player process appears in the list |
Temperature Monitoring
Hardware temperature exposure via SNMP depends on the device platform:
- Vendor-specific MIBs: Enterprise mini PC vendors (Intel NUC, ASUS NUC, Lenovo ThinkCentre) may expose temperature sensors under their enterprise MIB subtree. Download the vendor MIB from the manufacturer’s support site and import it into your NMS.
- lm-sensors via Net-SNMP (Linux): Install
lm-sensorsand configurepass_persistinsnmpd.confto expose sensor readings at the.1.3.6.1.4.1.2021.13.16OID subtree (LM-SENSORS-MIB). - IPMI via ipmitool (Linux): On servers with IPMI support,
ipmitoolcan read temperature from the BMC and publish values through Net-SNMP’spassdirective.
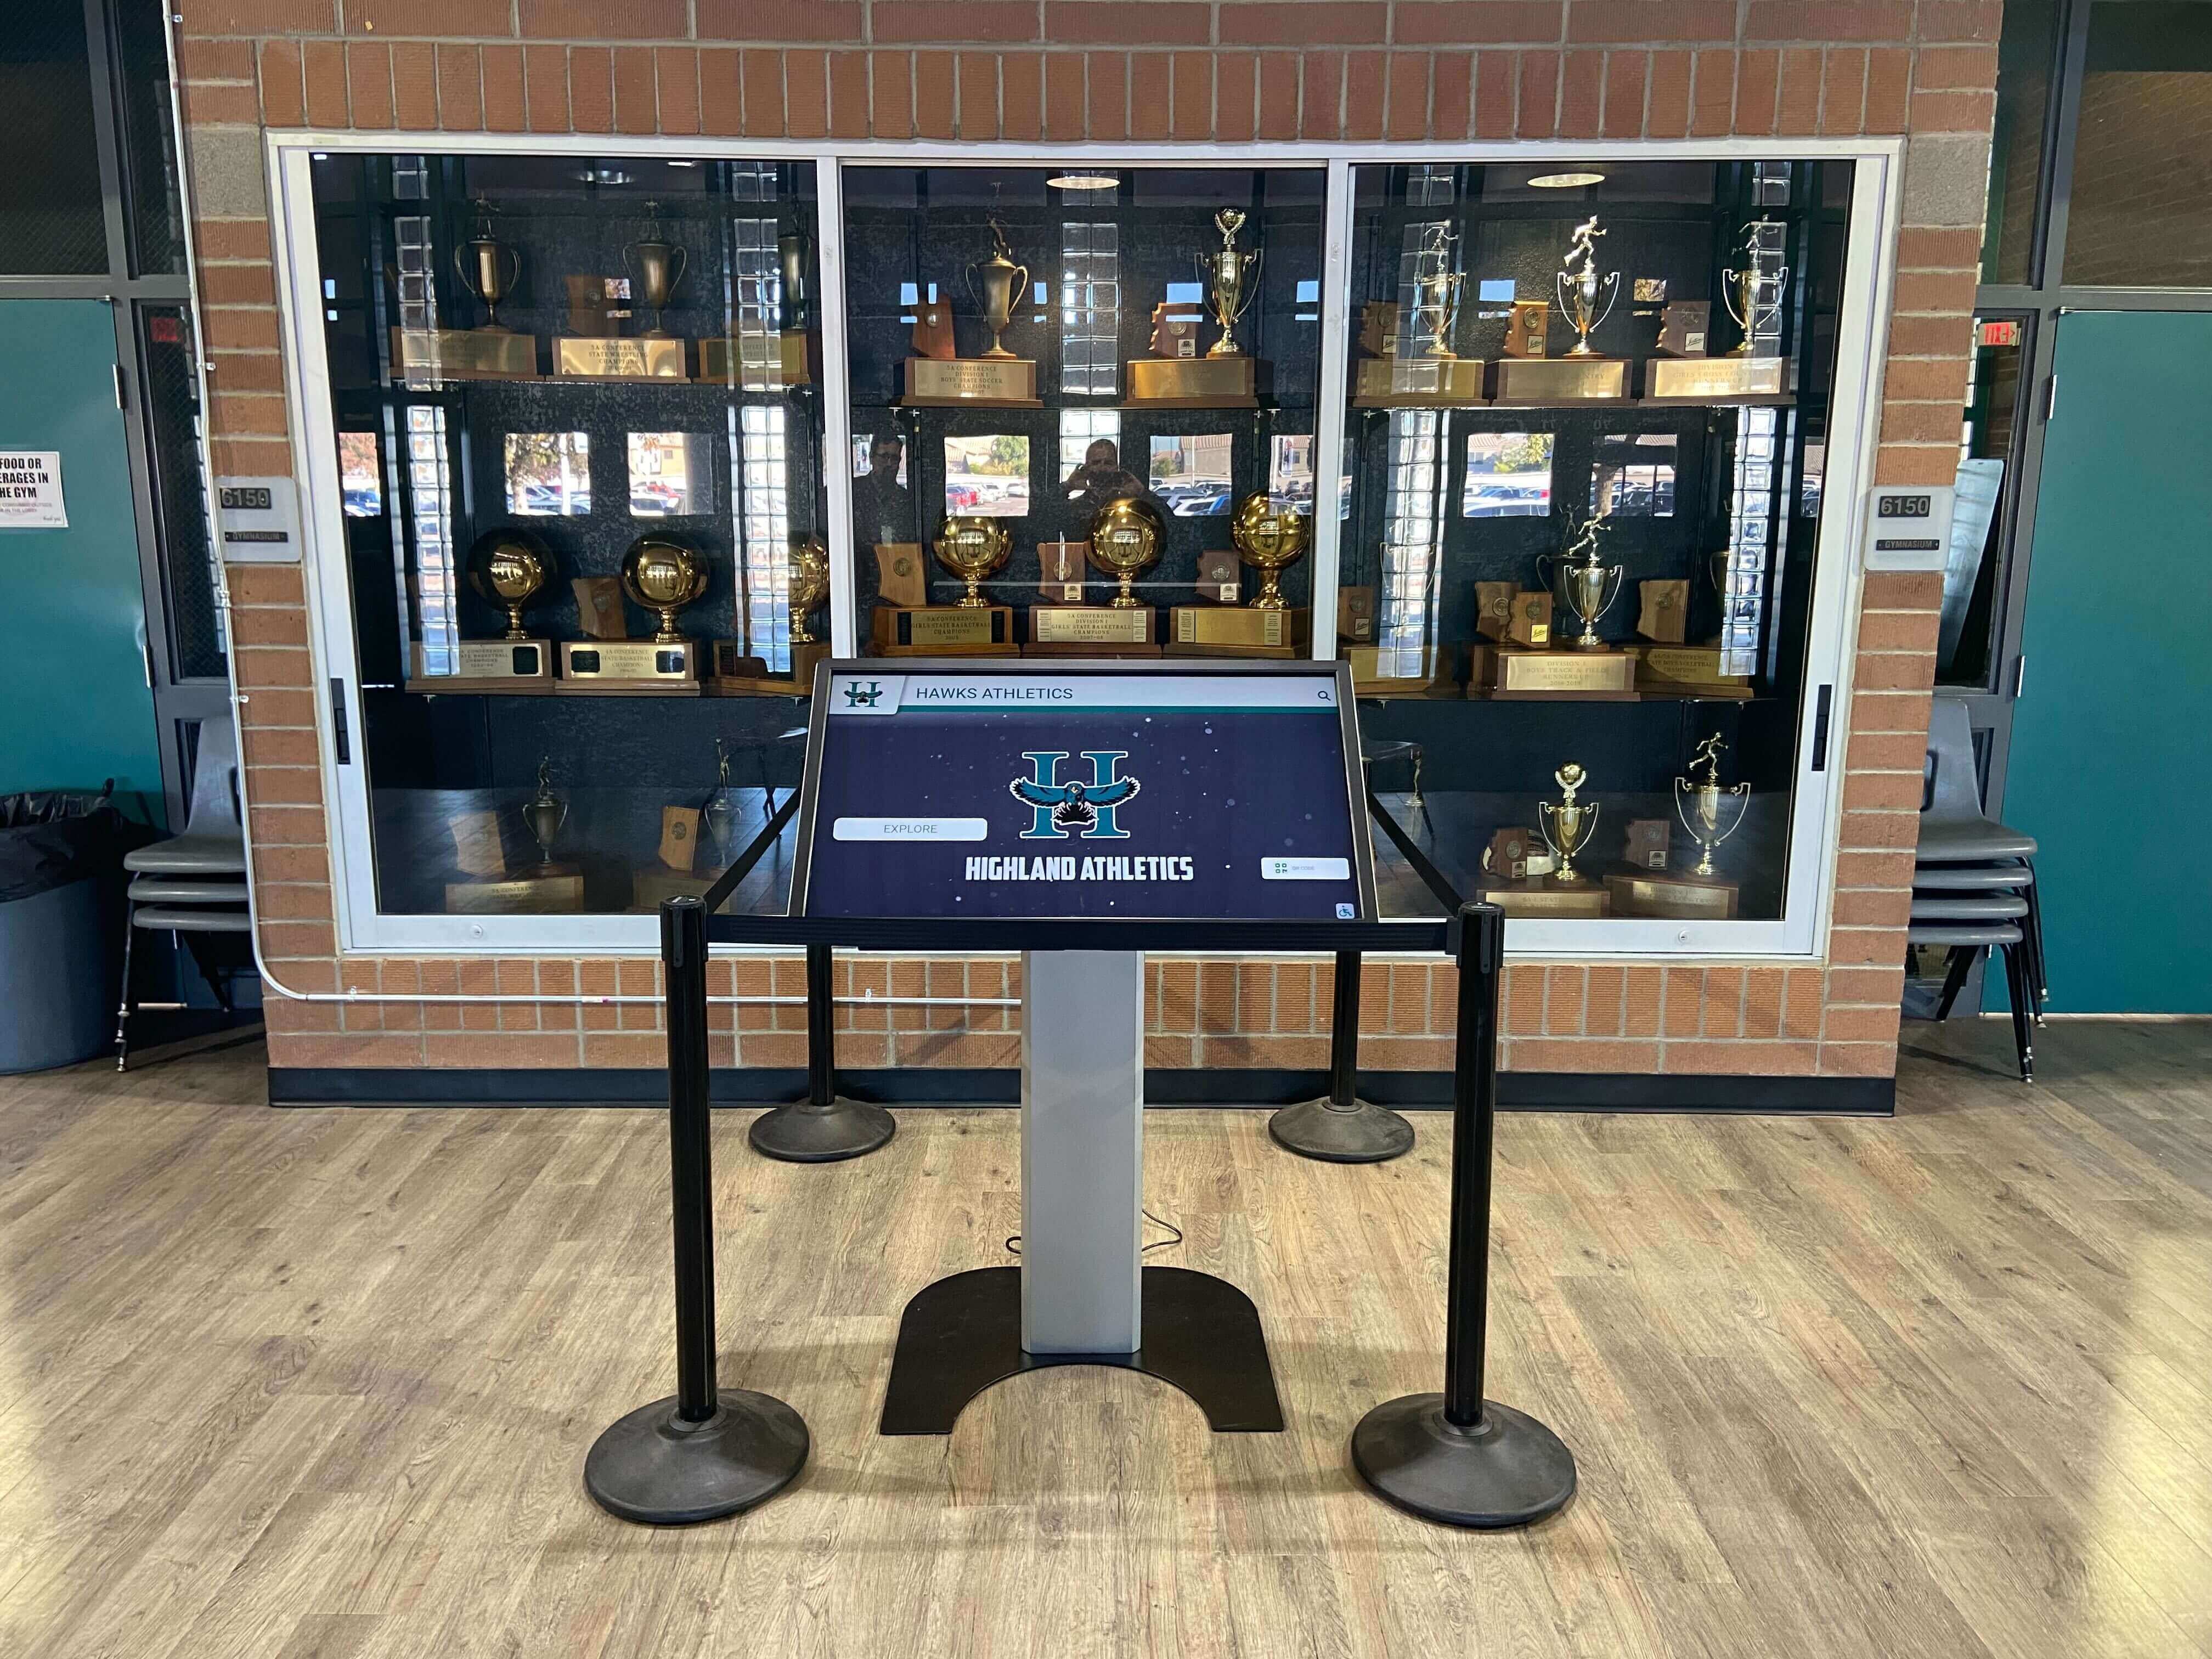
For recognition displays in enclosed enclosures or mounted in trophy case cabinets, temperature monitoring is particularly important. Enclosure-mounted mini PCs frequently exceed their rated operating temperature range during warm weather when ambient hallway temperatures rise and HVAC setback periods reduce air circulation. A temperature alert set at 85°C CPU threshold (or the vendor’s maximum continuous rating minus 10°C as a warning) gives IT teams time to address ventilation before a thermal shutdown takes the display offline.
Polling the Player Process via SNMP
Confirming that the recognition player application is running is more granular than confirming the OS is up. Query the hrSWRunTable (.1.3.6.1.2.1.25.4.2) and filter for the player process name. If the process is absent from the running process table, the player has crashed — even if the OS itself is healthy and responding to SNMP polls.
Most modern NMS platforms support this check through a custom SNMP item that performs a table walk and triggers an alert when the expected process name is not found. In Zabbix, use an SNMP dependent item with a preprocessing step to extract the relevant row. In LibreNMS, use a custom service check or an SNMP extend script.
This check complements a software watchdog timer: the watchdog restarts the player automatically, and the SNMP check tells you it happened so you can investigate frequency.
Phase 4: Set Alert Thresholds and Notification Rules
Recommended Threshold Table
Use these thresholds as a starting point. Adjust based on your hardware baseline — a mini PC that idles at 40% CPU under normal player operation needs a higher alert threshold than one that idles at 15%.
| Metric | Warning Threshold | Critical Threshold | Recovery Action |
|---|---|---|---|
| Uptime reset | Any reboot outside maintenance window | N/A — treat every unexpected reboot as critical | Investigate logs for crash or power event |
| Interface down | N/A | ifOperStatus ≠ 1 for 5+ minutes | Check switch port, cable, and device power |
| Interface errors | > 5 errors/minute (sustained 10 min) | > 50 errors/minute | Investigate cable, switch port, or NIC driver |
| CPU utilization | > 80% for 10 minutes | > 95% for 5 minutes | Check for runaway process; consider player restart |
| Memory available | < 20% free | < 10% free | Restart player; check for memory leak pattern |
| Disk utilization | > 80% full | > 90% full | Clear media cache; expand storage |
| CPU temperature | > 75°C sustained | > 85°C sustained | Check enclosure ventilation; clean dust filters |
| Player process absent | N/A | Process not found in hrSWRunTable | Alert immediately; watchdog may have already restarted |
| SNMP no-response | Missed 1 poll | Missed 3 consecutive polls | Verify power, network switch port, and device status |
Notification Rules for School IT Teams
Recognition display alerts have different urgency levels depending on when the failure occurs relative to scheduled school events. Structure your notification rules around two modes:
Standard hours (weekdays during school day):
- Warning: Create a helpdesk ticket automatically; notify IT coordinator by email.
- Critical: Page on-call IT contact by SMS or push notification within 5 minutes.
Event mode (evenings, weekends, scheduled ceremonies):
- Any alert: Page the facilities or athletic department contact designated for the event, along with the IT on-call contact.
- Implement an event schedule in your NMS that escalates alert priority for designated event windows.
Athletic recognition programs that display championship histories and athlete profiles during game-night ceremonies are exactly the context where a 3 a.m. alert that went unacknowledged becomes a visible failure at 6 p.m. — which is why event-mode escalation rules matter.
Alert Suppression During Maintenance
Create a recurring maintenance window in your NMS for each scheduled reboot or update event. Alerts generated during a suppression window are logged but do not trigger notifications, preventing alert fatigue from expected reboots. Most NMS platforms call this feature “Scheduled Downtime” (Zabbix), “Maintenance Mode” (LibreNMS), or “Downtime Schedules” (PRTG).
Document every maintenance window in your change log. If an unexpected alert fires during a suppression window — meaning the device did not come back cleanly after the maintenance operation — it should still be visible in the NMS event log even if the notification was suppressed.
Phase 5: SNMP Trap Configuration (Optional but Recommended)
SNMP traps are asynchronous notifications that devices send to the NMS when a specific event occurs, without waiting for the next poll cycle. For recognition displays, the most useful trap events are:
- linkDown / linkUp: Generated when the network interface changes state. A linkDown trap from a display device reaches the NMS within seconds of the cable being pulled or the switch port going down — far faster than waiting for the next poll cycle.
- coldStart / warmStart: Generated when the SNMP agent initializes, indicating a reboot. Receiving a coldStart trap at 2 a.m. from a display that has no scheduled maintenance tells you the device rebooted unexpectedly.
Configure trap reception on the NMS:
- Ensure the NMS trap receiver is running on UDP port 162.
- Configure each display device’s SNMP trap destination to point to the NMS server IP.
- On Windows, set the trap destination in SNMP Service Properties → Traps. Add the community name and NMS IP.
- On Linux with Net-SNMP, add
trap2sink <NMS-IP> <community>to/etc/snmp/snmpd.confand restart the daemon. - In the NMS, create trap-based alert rules for
linkDownandcoldStartevents from the recognition display host group.
Trap-based alerting complements poll-based alerting: polls detect gradual degradation (rising CPU, filling disk); traps detect discrete events (interface down, unexpected reboot) faster than the poll interval allows.
Phase 6: Validate the Monitoring Configuration
Run this validation sequence after adding each display device to the NMS for the first time, and after any OS update or network change.
Confirm baseline poll data. Wait one full polling cycle after adding the device. Verify that CPU, memory, disk, uptime, and interface metric graphs show populated data. An empty graph after two poll cycles indicates a polling error — check the community string, NMS source IP, and firewall rules.
Simulate an interface-down condition. During a maintenance window, disconnect the display device’s network cable for two minutes. Confirm the NMS generates an interface-down alert and (if traps are configured) receives a linkDown trap. Reconnect and confirm the NMS generates an interface-up recovery event.
Verify uptime reset detection. Reboot the display device. Confirm the NMS records an uptime reset event and generates the appropriate alert for an out-of-maintenance-window reboot type.
Test notification delivery. Trigger a test alert from the NMS and confirm the designated on-call contact receives the notification within the expected time window. Do this for both email and SMS/push channels.
Record baseline values. After one week of normal operation, document the baseline CPU utilization range, memory utilization range, and disk utilization percentage for each device. Use these baselines to tune your warning and critical thresholds to the actual operating profile of each unit.
Connecting SNMP Monitoring to Broader Recognition Display Operations
SNMP monitoring gives school IT teams real-time and trended visibility into the health of every recognition display endpoint on the network. It does not replace the other layers of a complete operational framework — but it integrates with them directly.
Patch management. When an OS update requires a device reboot, your NMS suppression window prevents false alerts during the maintenance operation. After the reboot, the uptime counter resets and the NMS confirms the device came back online cleanly. Schools maintaining digital record archives and historical recognition programs benefit from being able to document exactly when each display was last patched and restarted.
Watchdog timer coordination. When a software watchdog restarts the player application, the device uptime counter does not reset — only the player process restarts. SNMP monitoring of the process table detects the restart event separately from a full device reboot, giving you the ability to distinguish player-level failures from OS-level failures in your incident log.
Multi-screen deployments. Schools with display networks spanning multiple buildings can monitor every endpoint from a single NMS dashboard. Digital signage deployments with multi-screen and multi-widget configurations that serve recognition content across different areas of campus benefit from the same centralized visibility: one dashboard that tells you whether the athletics hallway display, the main lobby donor wall, and the library entrance kiosk are all healthy before the school day begins.
Budget and replacement planning. SNMP trending data produces a multi-semester record of how each device’s CPU utilization and temperature have changed over time. A mini PC whose idle CPU load has drifted from 20 percent to 65 percent over two years — without any change in content — is a device whose hardware is degrading. IT coordinators can present this data to administration when requesting hardware replacement, rather than waiting for a complete failure to justify the capital expense. Fundraising programs and capital campaigns that fund recognition display refreshes are easier to justify when the IT team can show trending data from the NMS demonstrating the hardware lifecycle.
Recognition Display SNMP Monitoring: Frequently Asked Questions
Q: Does SNMP monitoring work on proprietary digital signage appliances, or only on Windows and Linux controllers?
Most proprietary signage appliances expose at minimum the standard MIB-II system group (sysDescr, sysUpTime, sysContact) and the interfaces group (ifOperStatus, ifInErrors, ifOutErrors). Some expose HOST-RESOURCES-MIB. Vendor-specific MIBs for temperature and hardware health vary; download the MIB file from the vendor’s support portal and import it into your NMS before expecting that data to populate.
Q: How often should we poll recognition displays?
A 5-minute (300-second) polling interval is standard for most metrics. For interface operational status (ifOperStatus), a 1-minute interval is worthwhile if your NMS supports per-item polling frequency, since an interface-down condition at the start of a school event can be addressed in under 5 minutes if detected immediately. CPU and memory polling at 5 minutes is sufficient for trending purposes.
Q: Will SNMP monitoring slow down the recognition display or its network connection?
No. A standard SNMP poll request is a few hundred bytes of UDP traffic. Even polling 20 OIDs at 1-minute intervals produces negligible bandwidth consumption — well under 1 Kbps — and the processing overhead on the device is imperceptible.
Q: What if a recognition display is on a VLAN that blocks SNMP traffic to the NMS?
This is the most common commissioning obstacle for school deployments. The firewall or ACL between the display VLAN and the NMS VLAN must permit UDP 161 inbound to the display device from the NMS IP. Work with the network administrator to create a targeted inter-VLAN rule rather than opening broad routing between VLANs.
Q: Can SNMP monitoring detect whether the recognition content itself is current — for example, that a new athlete profile pushed last night is displaying?
No. SNMP monitors device and network health; it has no visibility into application-layer content or CMS data. To verify that content updates applied successfully, use the CMS audit log, a status callback feature in the recognition platform, or a screen-capture monitoring tool if the vendor provides one. Schools that maintain recognition programs tied to active athletics and award seasons often combine SNMP health monitoring with a weekly CMS content verification step to cover both the infrastructure layer and the content layer.
Q: Should we compare SNMP monitoring platforms before choosing one?
If your school already runs a network monitoring system for switches, access points, and servers, add the recognition displays to the existing platform rather than running a separate tool for display monitoring. Operational consolidation reduces the number of alert channels staff must monitor. If your district has no existing NMS, LibreNMS is a low-cost starting point with active community support and broad device template coverage. A comparison that includes the Rocket Alumni Solutions platform should focus on what application-level health visibility the CMS itself provides versus what the NMS handles at the device layer — they address different parts of the monitoring stack.
Ready to See How a Managed Recognition Platform Handles Device Visibility?
Rocket Alumni Solutions builds and supports touchscreen recognition systems for schools and athletic programs — including the operational infrastructure that keeps every lobby kiosk and hallway display visible, healthy, and maintained. Schedule a walkthrough to see the platform in action and ask how device health monitoring integrates with the CMS.
Schedule a Free TouchWall DemoConclusion
Recognition display SNMP monitoring closes the visibility gap between a device that last checked in during the morning setup and a device that fails during the evening ceremony. Adding each kiosk to your NMS as an SNMP-polled endpoint — with CPU, memory, disk, uptime, interface statistics, and temperature metrics — gives your IT team the trending data and real-time alerts needed to resolve issues before they become visible failures. Start with the master checklist at the top of this article, enable the agent on each device, add host entries to your NMS, configure thresholds from the recommended table, and validate the notification chain before the next scheduled event. The investment is low; the upside is a recognition program that runs reliably at every moment your school most needs it to perform.