From Dreams to Reality: Mastering the Financial Side of Digital Recognition
Every successful digital recognition wall project begins with a single moment of inspiration—perhaps envisioning alumni discovering their achievements on an interactive touchscreen, or imagining the pride on a student's face as they explore their school's rich history through engaging digital displays. But between that inspiring vision and its successful implementation lies a critical challenge that determines project success: comprehensive budget planning.
While the benefits of digital recognition walls are well-documented, the path from concept to completion is often complicated by unexpected costs, overlooked requirements, and budget surprises that can derail even the most well-intentioned projects. Smart administrators, principals, and alumni association leaders are discovering that successful digital recognition projects require more than just enthusiasm—they demand strategic financial planning that accounts for both visible and hidden costs while maximizing available savings opportunities.
This comprehensive guide will equip you with the insider knowledge needed to budget effectively for your digital recognition wall project. We’ll uncover the hidden costs that catch institutions off-guard, reveal practical savings strategies that stretch budgets further, and provide the frameworks needed to build a bulletproof budget that ensures project success from day one.
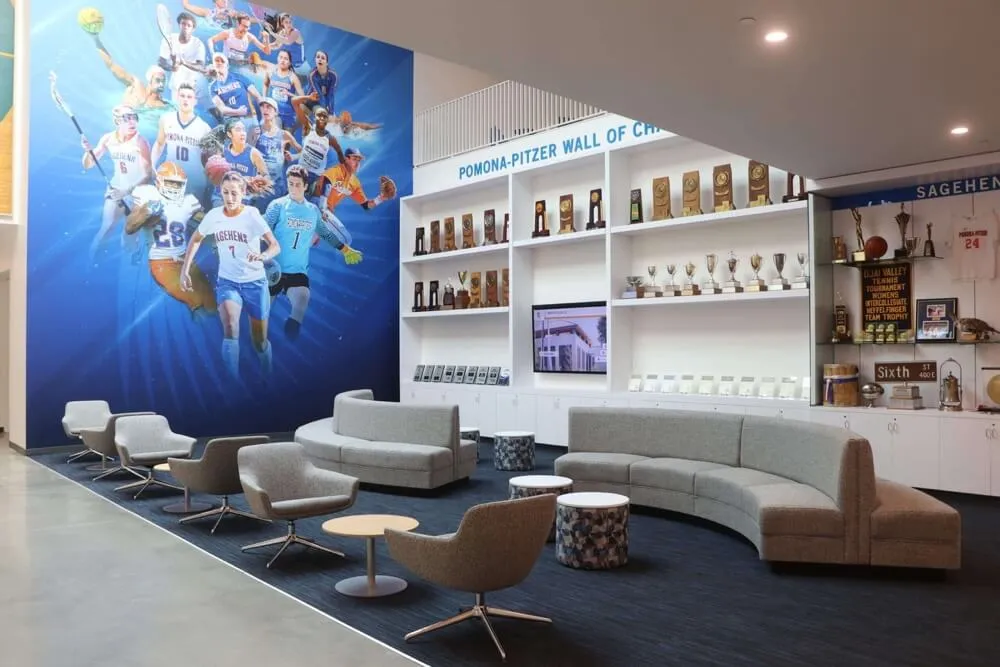
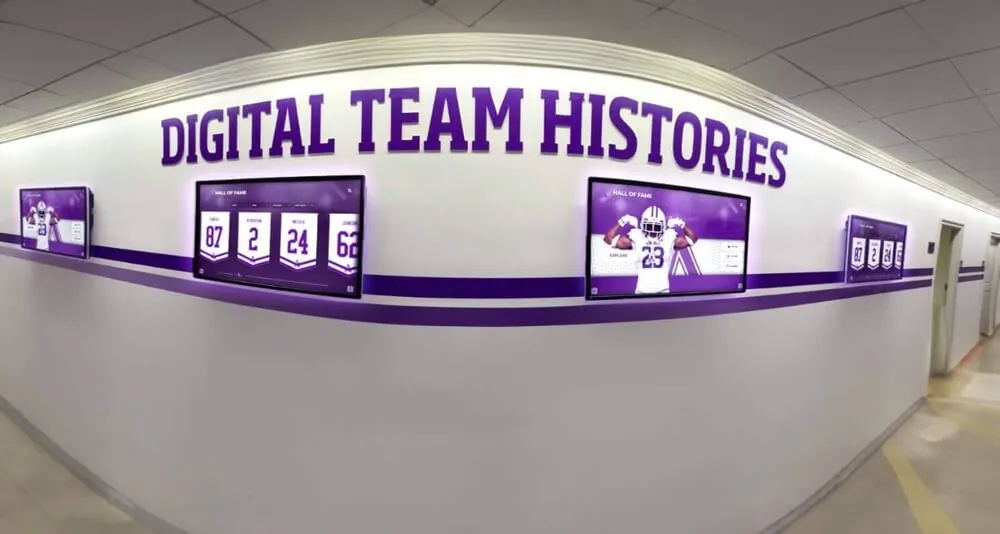
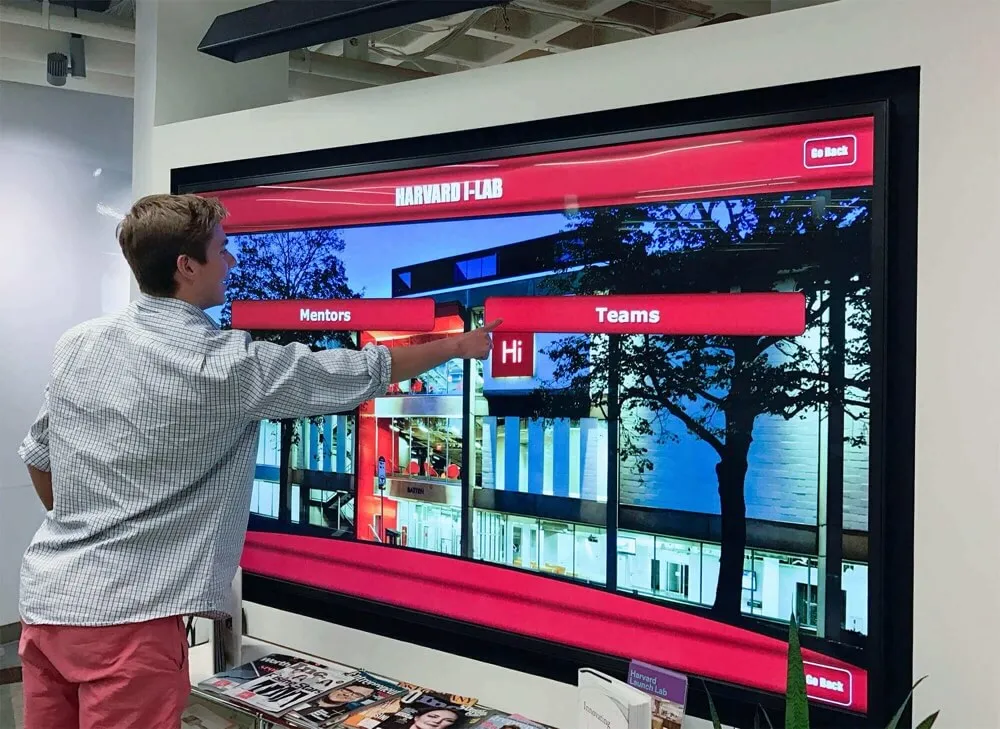
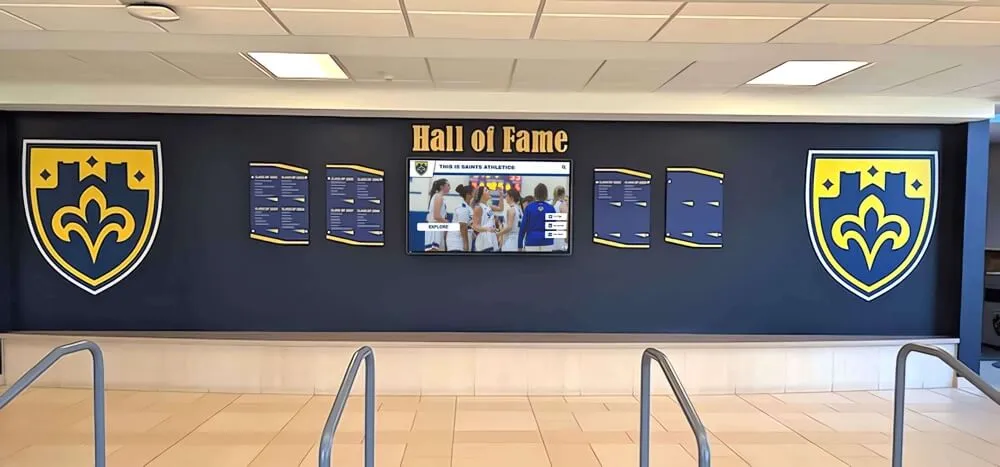
Successful digital recognition wall projects like this one at Pomona Pitzer require comprehensive budget planning that accounts for all project phases
The True Cost Landscape: Understanding Digital Recognition Wall Investment Components
Before diving into hidden costs and savings opportunities, it’s essential to understand the complete cost landscape of digital recognition wall projects. Unlike simple purchases, these implementations involve multiple cost categories that span both upfront investments and ongoing operational expenses.
Primary Investment Categories
Hardware Infrastructure (35-45% of total budget) The foundation of any digital recognition wall is its hardware ecosystem. This includes commercial-grade displays designed for 24/7 operation, specialized touchscreen interfaces that can withstand thousands of interactions, mounting systems engineered for security and accessibility, and media players or computing devices that power the interactive experience.
Commercial displays range from $3,500 for 55-inch units to $15,000+ for 85-inch 4K displays with advanced touch capabilities. The price differential between consumer and commercial-grade hardware is significant, but commercial units offer the reliability, warranty coverage, and longevity essential for institutional installations.
Software and Licensing (25-35% of total budget) Modern digital recognition walls depend on sophisticated software platforms that manage content, enable interactions, and provide administrative control. These solutions like Rocket Alumni Solutions typically involve initial licensing fees, ongoing subscription costs, and customization expenses to match institutional branding and requirements.
Software costs vary widely based on features, user capacity, and customization needs. Basic platforms may start around $5,000 annually, while comprehensive solutions with advanced analytics, mobile integration, and extensive customization can reach $25,000+ in initial setup costs plus ongoing subscriptions.
Installation and Integration (15-25% of total budget)
Professional installation ensures optimal performance and compliance with safety standards. This includes electrical work, network connectivity, secure mounting, calibration, and initial setup. Installation complexity varies significantly based on location, infrastructure requirements, and accessibility needs.
Content Development and Migration (10-20% of total budget)
Transforming existing recognition materials into engaging digital content requires significant effort. This includes digitizing historical photos, creating multimedia content, organizing information databases, and ensuring content meets accessibility standards for diverse users.
Hidden Cost #1: Infrastructure Requirements That Catch Schools Off-Guard
The most common budget surprise in digital recognition wall projects stems from infrastructure requirements that aren’t immediately obvious during initial planning. These “below-the-surface” costs can add 20-40% to project budgets if not properly anticipated.
Electrical Infrastructure Reality Check
Commercial-grade displays consume significantly more power than typical office equipment, often requiring dedicated 20-amp circuits to ensure stable operation. Many older buildings lack adequate electrical capacity at optimal display locations, necessitating electrical upgrades that can cost $2,500-$8,000 per installation point.
Beyond basic power requirements, consider surge protection systems ($500-$1,500), uninterruptible power supplies for critical installations ($800-$2,500), and emergency power integration if your facility has backup generators. These electrical enhancements ensure reliable operation and protect your investment from power-related issues.
Network Connectivity Complexities Modern digital recognition walls require robust network connectivity for content updates, cloud synchronization, and remote management. While Wi-Fi might seem adequate, professional installations typically require wired Ethernet connections for reliability and security.
Network infrastructure costs often include cable installation ($150-$300 per drop), network switch upgrades ($500-$2,000), increased internet bandwidth to handle multimedia content, and network security enhancements to protect connected devices. Schools with older networking infrastructure might need comprehensive upgrades costing $5,000-$15,000.
"We budgeted $25,000 for our digital wall of fame but didn't account for the electrical and network upgrades needed in our 1960s building. The additional $8,000 in infrastructure costs was a surprise, but our facilities team emphasized it was essential for long-term reliability."
— Principal, Mountain View High School
Environmental and Security Considerations
Climate control impacts often go unrecognized during initial planning. Large displays generate substantial heat, potentially requiring HVAC adjustments in enclosed spaces. Additionally, direct sunlight can damage displays and create glare issues, necessitating window treatments or structural modifications.
Security infrastructure includes theft-deterrent mounting systems, access control for administrative interfaces, and surveillance integration to protect valuable equipment. These security measures typically add $1,500-$4,000 to project costs but are essential for protecting your investment.
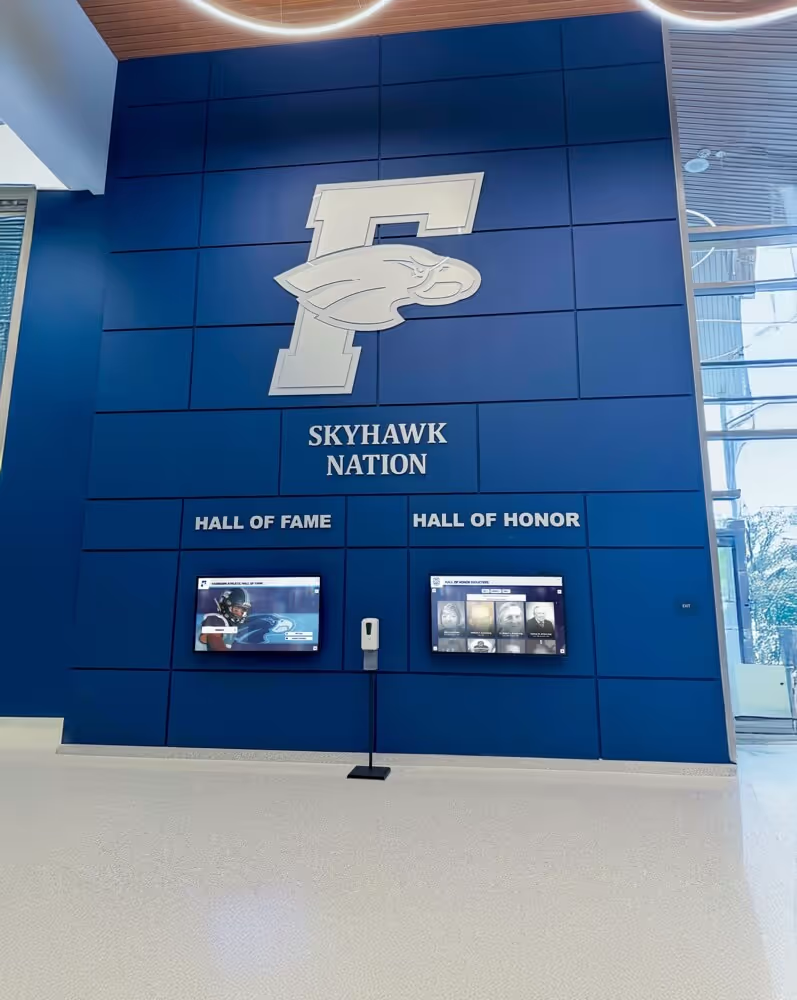
Proper infrastructure planning ensures reliable operation and prevents costly post-installation modifications
Hidden Cost #2: Content Creation and Migration Realities
One of the most underestimated aspects of digital recognition wall budgets involves the time, effort, and expertise required to create compelling digital content from existing recognition materials. This process often proves more complex and time-intensive than initially anticipated.
Historical Content Digitization Challenges
Most institutions have decades of recognition materials stored in various formats—from faded photographs and typewritten documents to trophy inscriptions and newspaper clippings. Converting these materials into high-quality digital content suitable for interactive displays requires specialized skills and equipment.
Professional digitization services typically charge $5-$15 per photograph, $25-$75 per document page, and $100-$300 per hour for video or audio material conversion. A typical high school might have 2,000-5,000 items requiring digitization, creating costs of $15,000-$35,000 for comprehensive historical content migration.
Content Quality and Consistency Standards Digital recognition walls demand consistent, high-quality content that maintains engagement and reflects positively on your institution. This often means hiring professional photographers for new content ($150-$300 per session), copywriters for compelling biographical content ($50-$150 per profile), and graphic designers for visual consistency ($75-$150 per hour).
Many institutions underestimate the time required for content review, fact-checking, and approval processes. Administrative staff time for content management during the migration phase often equals 40-80 hours per 100 profiles, representing significant opportunity costs in staff productivity.
Ongoing Content Development Investment
Beyond initial migration, digital recognition walls require ongoing content development to maintain engagement and relevance. Annual content needs typically include:
- 50-150 new profiles or updates for recent graduates and achievements
- Seasonal content updates for events, campaigns, and celebrations
- Multimedia content creation including videos, interactive timelines, and multimedia presentations
- Content optimization based on usage analytics and visitor feedback
Budget $5,000-$15,000 annually for ongoing content development, or allocate dedicated staff time equivalent to 10-20% of one full-time position for content management responsibilities.
Content Development Cost Calculator
- Historical Photo Digitization: 1,500 photos × $8 average = $12,000
- Professional Photography: 25 sessions × $200 average = $5,000
- Biographical Content Writing: 200 profiles × $75 average = $15,000
- Design and Layout Work: 120 hours × $125 average = $15,000
- Staff Time for Review/Coordination: 200 hours × $35 average = $7,000
- Total Content Development Investment: $54,000
Hidden Cost #3: Training and Change Management Investment
The human side of digital recognition wall implementation often represents the most overlooked budget category, yet it’s critical for project success. Effective training and change management ensure your investment delivers intended benefits and gains widespread adoption.
Staff Training and Skill Development
Digital recognition walls introduce new workflows, software platforms, and administrative responsibilities that require comprehensive training. Most institutions need to train 3-8 staff members on content management systems, basic troubleshooting, and ongoing maintenance procedures.
Professional training typically costs $1,500-$3,500 per platform, plus travel expenses if conducted on-site. However, the larger investment involves staff time during the learning curve—expect productivity impacts equivalent to 20-30% reduction for the first 30-60 days as staff adapt to new systems.
Consider ongoing training needs as staff turnover occurs and software platforms evolve. Budget $2,000-$4,000 annually for refresher training, new user onboarding, and platform updates.
Community Education and Adoption Support Success depends on community adoption, which requires education efforts targeted at faculty, students, alumni, and visitors. This might include orientation sessions, printed guides, video tutorials, and promotional campaigns to build awareness and encourage interaction.
Community education efforts typically require 40-80 hours of staff time plus materials costs of $1,000-$3,000. While not always counted in direct project costs, these efforts significantly impact success rates and should be planned accordingly.
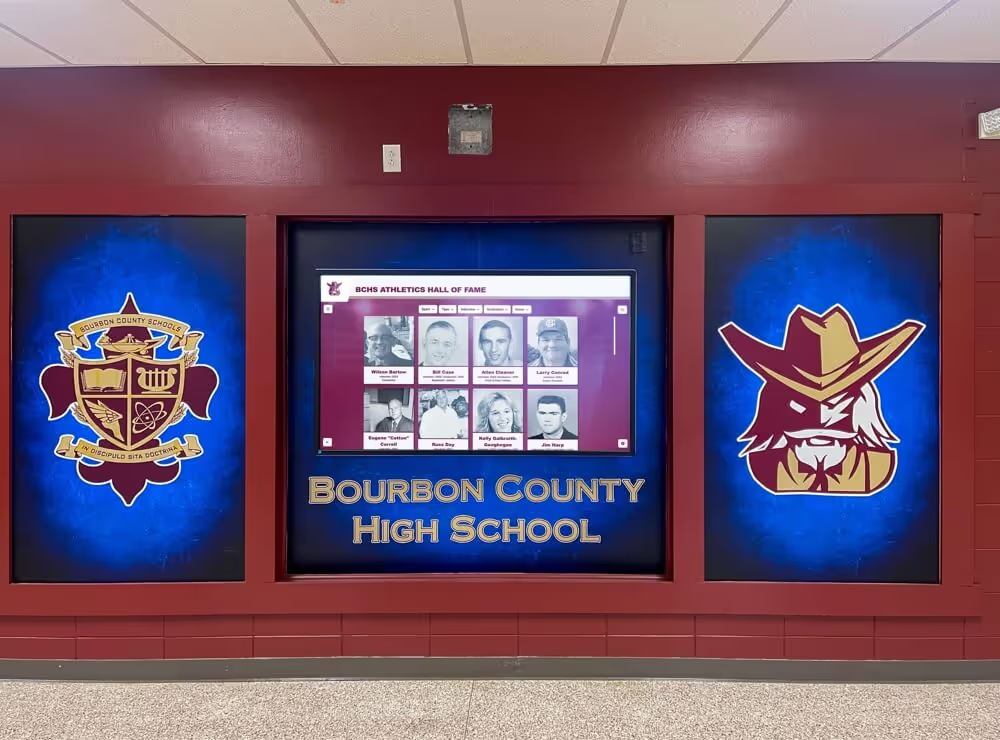
Comprehensive staff training ensures smooth operations and maximizes the return on your digital recognition wall investment
Smart Savings Strategy #1: Strategic Timing and Vendor Negotiations
Timing plays a crucial role in digital recognition wall project costs. Smart administrators leverage seasonal purchasing patterns, educational discounts, and vendor incentives to reduce overall project expenses significantly.
Optimal Purchasing Windows
Educational technology vendors often offer substantial discounts during specific periods to meet sales quotas and clear inventory. The best pricing typically occurs during:
Summer Installation Season (June-August) While demand is high during summer months, many vendors offer package deals and expedited installation to maximize seasonal revenue. Schools benefit from faster project completion and often receive 5-10% discounts for summer installations.
Fiscal Year-End Periods (December and September) Vendors frequently offer aggressive pricing during their fiscal year-end periods to meet annual targets. These periods can yield 15-25% savings on hardware and software packages, though project timelines might be compressed.
Educational Conference Seasons Technology vendors launching new products at major educational conferences often provide special introductory pricing. Attending conferences like NCEA, CASE, or regional education technology events can yield significant savings opportunities.
Negotiation Strategies That Work
Bundle Package Approach Rather than purchasing hardware, software, installation, and training separately, negotiate comprehensive packages that include all project components. Bundled pricing typically saves 10-20% compared to individual component purchases while simplifying vendor management.
Multi-Year Agreements Software licensing costs can be reduced significantly through multi-year commitments. Three-year agreements often provide 20-30% savings compared to annual licensing, while five-year agreements can yield even greater reductions.
Standardization Benefits If your institution has multiple locations or campuses, standardizing on a single platform like Rocket Alumni Solutions creates leverage for volume pricing. Vendors often provide substantial discounts for multi-site implementations ranging from 15-40% based on scale.
Vendor Negotiation Checklist
- Request detailed pricing breakdowns for all components to identify negotiation opportunities
- Ask about educational discounts, non-profit rates, and government pricing that might apply to your institution
- Inquire about demo unit programs that allow extended evaluation periods before purchase
- Explore financing options including lease-to-own arrangements that spread costs over time
- Negotiate extended warranties and service agreements to protect long-term investment
- Request training credits or professional services as part of package negotiations
Smart Savings Strategy #2: Phased Implementation Approaches
Rather than attempting to implement a comprehensive digital recognition wall system immediately, many successful institutions use phased approaches that spread costs over time while delivering immediate value.
Start Small, Scale Smart
Phase 1: Core Recognition Display (Months 1-6) Begin with a single, high-impact display in your most visible location—typically the main entrance, athletic facility, or administrative building lobby. This initial phase typically represents 30-40% of total project costs but delivers 60-70% of immediate impact.
Focus initial content on your most celebrated achievements and recent recognitions to create immediate community engagement. This approach allows you to refine workflows, train staff, and demonstrate value before expanding.
Phase 2: Content Expansion and Integration (Months 6-18) Once your initial display is operational and staff are comfortable with management processes, expand content depth and breadth. This phase involves migrating historical materials, adding multimedia content, and integrating with existing school systems.
Content expansion can often be handled by trained internal staff, reducing costs while building institutional expertise. Many schools involve student clubs, volunteer groups, or work-study programs to support content development efforts.
Phase 3: System Expansion and Advanced Features (Months 18-36) After establishing successful operations, consider expanding to additional locations, adding interactive features, or integrating mobile applications. This phased approach allows you to apply lessons learned and negotiate better pricing based on proven success.
Advanced features might include donor recognition integration, event calendar connections, social media feeds, or mobile app development. These enhancements build on your established foundation and can often be funded through demonstrated ROI or additional grants.
Financing and Budget Distribution Strategies
Capital vs. Operating Budget Optimization Many institutions find success by splitting project costs across capital and operating budgets. Hardware and installation typically qualify for capital funding, while software licensing and ongoing services can be categorized as operational expenses.
This approach often makes large projects more manageable within existing budget frameworks and can access different funding sources for various project components.
Grant Funding and Fundraising Integration Digital recognition walls often qualify for multiple funding sources including education technology grants, alumni association special projects, major donor naming opportunities, and community foundation grants for school improvement.
Consider creating fundraising campaigns specifically for recognition wall projects, highlighting the community engagement and alumni connection benefits. Many successful projects combine institutional funding with community donations and grant awards.
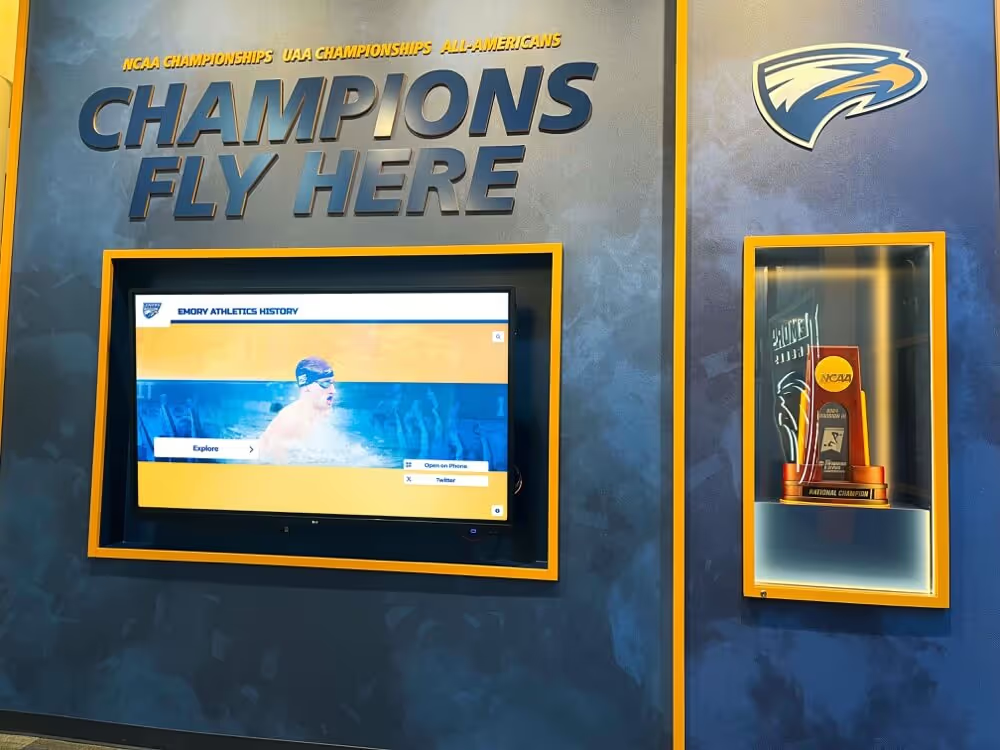
Phased implementation allows institutions to start with core functionality and expand capabilities based on success and budget availability
Smart Savings Strategy #3: Leveraging Internal Resources and Community Support
One of the most effective ways to control digital recognition wall costs involves maximizing internal resources and community volunteer support for appropriate project components.
Staff Skills and Existing Resources
IT Department Integration Many schools possess internal IT expertise that can handle network infrastructure, basic installation support, and ongoing technical maintenance. Involving IT staff in project planning ensures optimal integration with existing systems while reducing external support costs.
IT departments can typically handle network setup, user account management, basic troubleshooting, and software updates, potentially saving $5,000-$15,000 in external support costs annually.
Marketing and Communications Team Collaboration Schools with marketing or communications staff can often handle content creation, graphic design, and promotional activities internally. These teams bring institutional knowledge and branding expertise that external contractors might lack.
Internal marketing teams can create compelling content, maintain visual consistency, and develop promotional campaigns that encourage community engagement with recognition displays.
Community Volunteer Engagement
Alumni and Parent Involvement Many successful projects leverage alumni and parent volunteers for content digitization, historical research, and ongoing maintenance activities. This approach reduces costs while building community investment in project success.
Alumni often possess valuable historical knowledge, professional skills in photography or design, and enthusiasm for supporting recognition efforts. Parent volunteers can provide administrative support, content organization, and promotional assistance.
Student and Academic Integration Digital recognition walls provide excellent opportunities for academic integration across multiple subjects. History classes can research and develop historical content, English classes can write biographical profiles, art classes can create visual content, and technology classes can assist with technical support.
This integration provides educational value while reducing content development costs. Many schools report 30-50% reductions in external content creation expenses through strategic academic integration.
"Our digital wall of fame became a community project. Alumni volunteers digitized historical photos, parents helped with research, and our journalism class wrote biographical content. What could have cost $20,000 in external services was completed for under $5,000 while creating incredible community engagement."
— Development Director, Riverside Community College
Community Cost Savings
- Content digitization: $15,000 → $3,000
- Historical research: $8,000 → $1,500
- Photography: $5,000 → $500
- Content writing: $12,000 → $2,000
- Total savings: $31,000
Comprehensive Budget Planning Framework
Creating a successful digital recognition wall budget requires systematic planning that accounts for all cost categories while building in appropriate contingencies and growth planning.
The Complete Budget Template
Initial Investment Breakdown (Total: $45,000-$85,000 for comprehensive installation)
Hardware Infrastructure (40% of budget)
- Commercial display system: $8,000-$18,000
- Touchscreen interface technology: $2,000-$5,000
- Mounting and security systems: $1,500-$3,500
- Media player and computing hardware: $1,000-$2,500
- Cables, accessories, and spare parts: $500-$1,500
Software and Platform (30% of budget)
- Software licensing (first year): $5,000-$15,000
- Customization and branding: $2,000-$8,000
- Integration and setup: $1,500-$4,000
- Initial training and documentation: $1,000-$3,000
Installation and Infrastructure (20% of budget)
- Professional installation: $2,500-$6,000
- Electrical infrastructure: $1,500-$5,000
- Network connectivity: $1,000-$3,000
- Environmental modifications: $500-$2,000
Content Development (10% of budget)
- Historical content digitization: $3,000-$8,000
- Professional content creation: $2,000-$6,000
- Initial content organization: $1,000-$3,000
Annual Operating Budget Planning
Ongoing Expenses (Annual: $8,000-$15,000)
Software and Services (60% of annual budget)
- Software licensing renewal: $3,000-$8,000
- Cloud storage and bandwidth: $600-$1,500
- Technical support services: $1,200-$2,500
Content and Maintenance (25% of annual budget)
- Content updates and additions: $1,500-$4,000
- Professional photography/videography: $500-$1,500
- Staff training and development: $500-$1,000
Contingency and Growth (15% of annual budget)
- Hardware maintenance and repairs: $800-$1,500
- Software upgrades and new features: $500-$2,000
- Expansion planning reserves: $700-$1,500
Budget Planning Worksheet
Use this framework to create your institution-specific budget:
- Define project scope: Number of displays, locations, content volume
- Assess infrastructure needs: Electrical, network, environmental requirements
- Calculate content requirements: Historical materials, new content, ongoing needs
- Factor in training and support: Staff time, community education, change management
- Add contingency reserves: 15-20% for unexpected costs and opportunities
- Plan financing strategy: Capital vs. operating budgets, grant opportunities, phasing options
Grant Funding and Financing Options
Digital recognition walls often qualify for diverse funding sources that can significantly reduce institutional budget impact. Understanding and accessing these opportunities requires strategic planning and proposal development.
Education Technology Grants
Federal Funding Opportunities Several federal programs provide funding for educational technology initiatives that enhance learning environments and community engagement. Title IV funds often support technology investments that improve school culture and climate, while Rural Education Achievement grants can fund technology projects in qualifying communities.
E-rate funding may cover network infrastructure improvements required for digital recognition wall connectivity, particularly in schools serving high-need populations.
State and Regional Grants Many states offer specific funding for educational technology improvements, school modernization, or alumni engagement initiatives. These programs vary significantly by state but often provide matching funds or full grants for qualifying projects.
Regional education cooperatives and intermediate school districts frequently offer grant opportunities for innovative technology implementations that can be shared or replicated across member districts.
Private and Corporate Funding Sources
Alumni Association and Foundation Support Alumni associations and educational foundations often prioritize recognition and engagement projects that strengthen community connections. These organizations understand the value of recognition programs and may provide full or partial funding for digital walls of fame.
Present proposals that emphasize community engagement, alumni connection, and institutional pride benefits rather than purely technical features.
Corporate Sponsorship and Partnerships Local businesses and major corporations often support educational technology initiatives, particularly those that enhance community engagement or demonstrate innovation. Technology companies may provide equipment discounts or sponsorship in exchange for case study opportunities.
Consider naming rights or recognition opportunities for major sponsors, creating win-win partnerships that reduce costs while acknowledging community supporters.
Community-supported recognition walls create lasting impact while demonstrating successful grant funding utilization
ROI Calculation and Long-Term Value Assessment
Understanding the return on investment for digital recognition wall projects requires analyzing both quantifiable benefits and strategic value creation that supports broader institutional goals.
Quantifiable ROI Components
Operational Cost Savings Digital recognition walls eliminate ongoing costs associated with traditional recognition methods. Annual savings typically include:
- Plaque and trophy production: $2,000-$8,000 annually
- Printing and materials: $1,500-$4,000 annually
- Display case maintenance and updates: $1,000-$3,000 annually
- Staff time for manual updates: $3,000-$8,000 annually (valued at average hourly rates)
These operational savings often total $7,500-$23,000 annually, providing substantial ongoing value that compounds over the system’s lifespan.
Alumni Engagement and Fundraising Impact Institutions with digital recognition walls typically report 15-35% increases in alumni engagement metrics, including event attendance, communication response rates, and donation participation. While individual results vary, the average fundraising improvement ranges from $25,000-$150,000 annually for typical secondary schools and $100,000-$500,000 for colleges and universities.
Recruitment and Marketing Value Enhanced recognition programs contribute to institutional marketing and student recruitment efforts. The marketing value of professional recognition displays, social media engagement, and community pride is difficult to quantify but often equivalent to $10,000-$30,000 in traditional marketing expenses annually.
Strategic Value Creation
Community Connection Enhancement Digital recognition walls strengthen community relationships by providing accessible, engaging ways for alumni, families, and visitors to connect with institutional history and achievements. This community connection supports long-term sustainability, political support, and resource development in ways that extend far beyond immediate financial returns.
Institutional Positioning and Reputation Modern recognition systems position institutions as forward-thinking, technologically sophisticated, and committed to honoring achievement. This positioning supports competitive advantage in student recruitment, staff retention, and community relationships.
Legacy Preservation and Accessibility Digital systems ensure that institutional history and achievements remain accessible and engaging for future generations. This preservation value protects decades of accumulated recognition while making it searchable, shareable, and continuously relevant.
ROI Timeline Expectations
- Year 1: 40-60% ROI from operational savings and initial engagement improvements
- Year 2-3: 75-100% ROI as fundraising and recruitment benefits compound
- Year 4-7: 150-300% cumulative ROI from sustained engagement and community impact
- Long-term: Continued value creation through enhanced community connections and institutional positioning
Risk Management and Contingency Planning
Successful digital recognition wall projects require proactive risk management that addresses potential challenges before they impact budgets or timelines.
Technical Risk Mitigation
Hardware Reliability and Warranties Commercial-grade displays designed for continuous operation provide significantly better reliability than consumer alternatives, but extended warranties and service agreements protect against unexpected failures. Budget 10-15% of hardware costs for comprehensive warranty coverage and rapid replacement services.
Consider redundancy planning for critical installations, particularly in high-visibility locations where downtime creates negative community impact.
Software Platform Stability Choose established software platforms like Rocket Alumni Solutions that demonstrate long-term viability, regular updates, and responsive support. Avoid proprietary or niche solutions that might become unsupported over time.
Ensure data export capabilities and avoid vendor lock-in situations that could create costly migrations in the future.
Budget Risk Protection
Contingency Fund Management Allocate 15-20% of total project budget for contingency needs including:
- Unexpected infrastructure requirements discovered during installation
- Additional content development needs identified during migration
- Training and support requirements that exceed initial estimates
- Technology upgrades or enhancements that become available during implementation
Scope Management and Change Control Establish clear project scope boundaries and formal change control processes that evaluate cost impacts before approving modifications. Scope creep represents the most common cause of budget overruns in technology projects.
Document all requirements clearly and ensure stakeholder agreement before beginning implementation to avoid costly modifications later.
"Our contingency fund saved the project when we discovered our electrical panel needed upgrades. Having 20% contingency meant we could handle the $6,000 surprise without delaying installation or compromising quality. It was the best budgeting decision we made."
— Finance Director, Heritage Academy
Implementation Timeline and Cash Flow Management
Managing cash flow throughout digital recognition wall implementation requires careful timing coordination between project phases and budget availability.
Phased Payment Structure
Design and Planning Phase (20% of budget) Initial payments typically cover project design, site assessment, content planning, and system configuration. This phase usually spans 4-8 weeks and requires 15-25% of total project budget.
Front-loading design investment ensures proper planning and reduces costly modifications during implementation phases.
Manufacturing and Preparation Phase (40% of budget) Hardware procurement, software customization, and content development typically require the largest single payment, usually due upon order confirmation. This phase may span 6-12 weeks depending on customization requirements.
Installation and Launch Phase (30% of budget) Installation, training, and system activation typically require payment upon completion and acceptance testing. This final phase usually spans 2-4 weeks for single installations.
Warranty and Support Phase (10% of budget) Extended warranties and first-year support services are often invoiced separately or as part of ongoing service agreements.
Budget Timing Optimization
Fiscal Year Planning Align project phases with institutional budget cycles to optimize cash flow and take advantage of end-of-year spending opportunities. Many schools find success beginning projects in spring for summer installation, utilizing both current and new fiscal year budgets.
Seasonal Installation Benefits Summer installations often provide the best balance of vendor pricing, staff availability, and minimal disruption to normal operations. Plan project timelines to complete installation during summer breaks when possible.
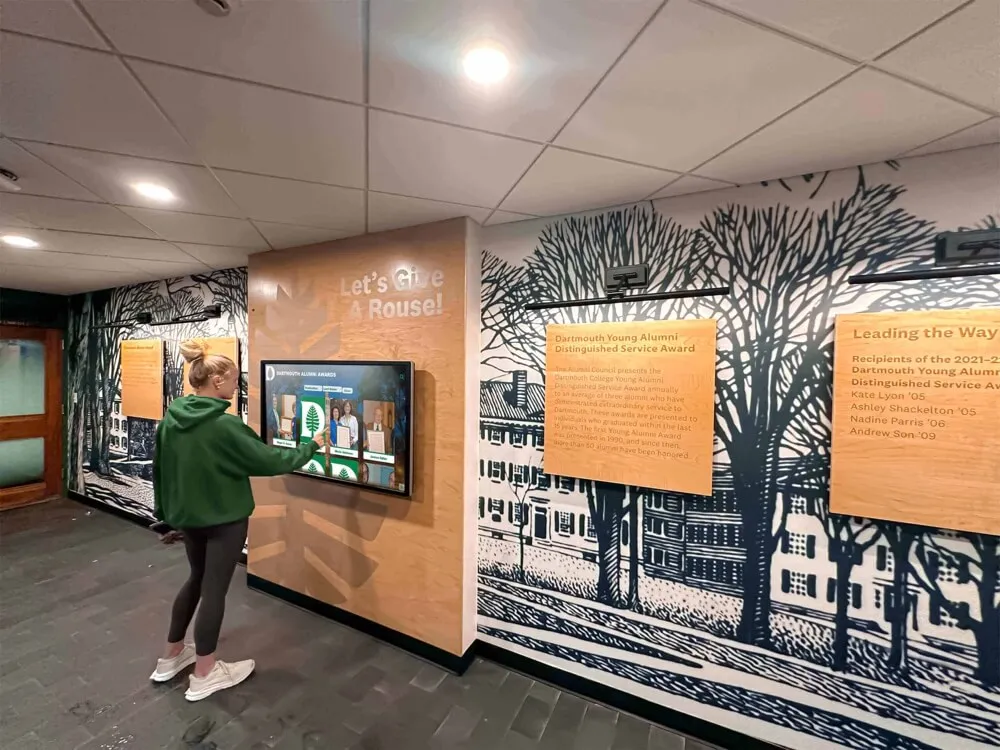
Strategic timing and phased implementation ensure smooth project completion within budget and timeline requirements
Success Metrics and Performance Tracking
Measuring the success of your digital recognition wall investment requires establishing baseline metrics and tracking key performance indicators that demonstrate value creation.
Engagement Analytics
User Interaction Metrics Modern digital recognition platforms provide detailed analytics about user behavior including:
- Daily and monthly active users
- Average session duration and interaction depth
- Most popular content categories and individual profiles
- Search terms and navigation patterns
- Peak usage times and seasonal trends
These metrics help optimize content strategy and demonstrate community engagement levels that support ROI calculations.
Content Performance Tracking Understanding which content generates the most engagement helps inform ongoing development priorities and ensures limited resources focus on high-impact areas. Track metrics like profile views, multimedia engagement, and social sharing activity.
Financial Performance Indicators
Fundraising Attribution Work with development staff to track alumni giving patterns before and after recognition wall implementation. Many institutions use donor surveys and campaign analysis to identify recognition-related giving increases.
Operational Efficiency Gains Document time savings in recognition program management, reduction in traditional signage costs, and staff productivity improvements related to streamlined processes.
Recruitment Impact Assessment Monitor prospective student and family feedback about campus visits, application rates following tours that include recognition wall interactions, and enrollment decision factors that reference recognition programs.
Ready to Build Your Smart Budget Plan?
Transform your vision into reality with comprehensive budget planning that accounts for all costs while maximizing available savings and funding opportunities. Don't let hidden costs derail your project—plan smart from the start.
Conclusion: Budget Confidence Builds Project Success
Smart budget planning forms the foundation of every successful digital recognition wall project. By understanding the complete cost landscape—including hidden infrastructure requirements, content development realities, and training investments—you can create comprehensive budgets that deliver project success without financial surprises.
The strategies outlined in this guide—from strategic timing and vendor negotiations to phased implementation and community resource leveraging—provide practical tools for maximizing your budget impact while minimizing unnecessary expenses. Remember that digital recognition walls represent long-term investments in community engagement, institutional pride, and alumni connection that generate returns far beyond their initial costs.
Success comes from thorough planning, realistic expectations, and strategic resource utilization. Whether you’re implementing a single display or a comprehensive recognition system, the budgeting frameworks and cost management strategies in this guide will help ensure your project achieves its goals while staying within financial parameters.
The key to budget confidence lies in comprehensive planning, proactive risk management, and leveraging the expertise of established providers like Rocket Alumni Solutions who understand both the technical requirements and institutional realities of digital recognition wall implementations.
Start with a clear vision, build a detailed budget that accounts for all cost categories, and implement with confidence knowing that your financial planning supports long-term project success and sustainable community impact.