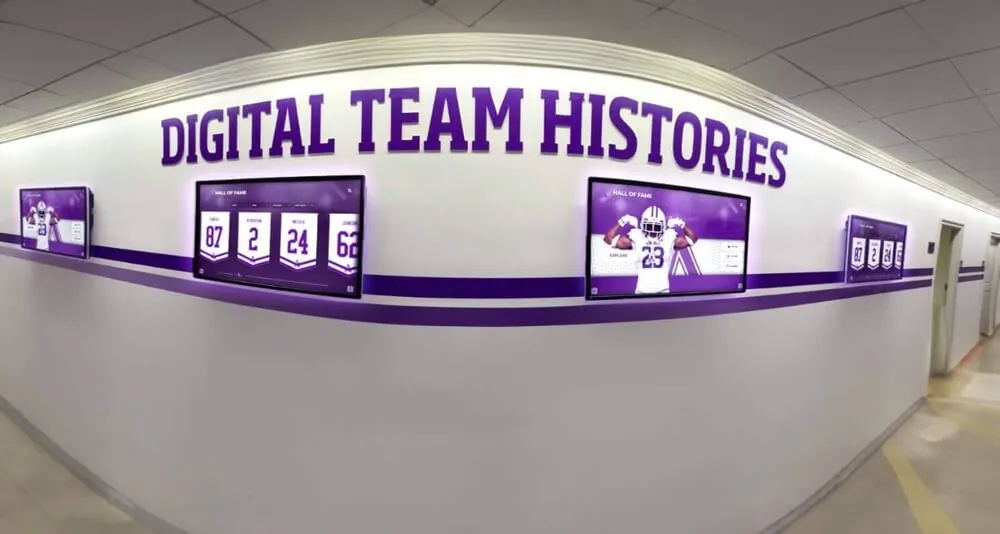
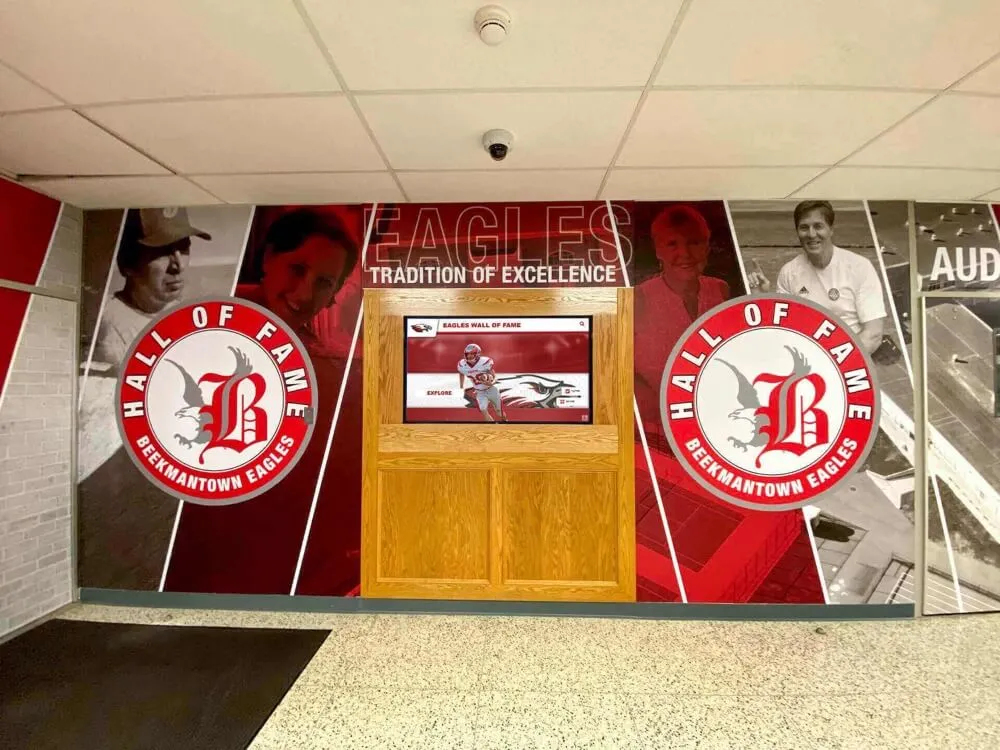
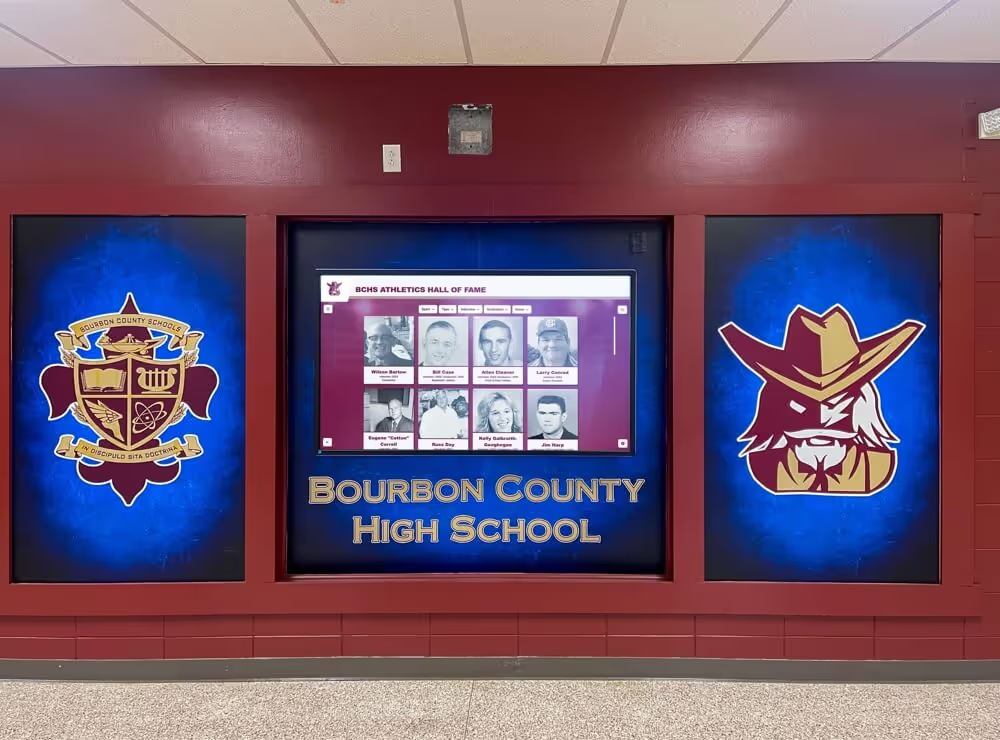
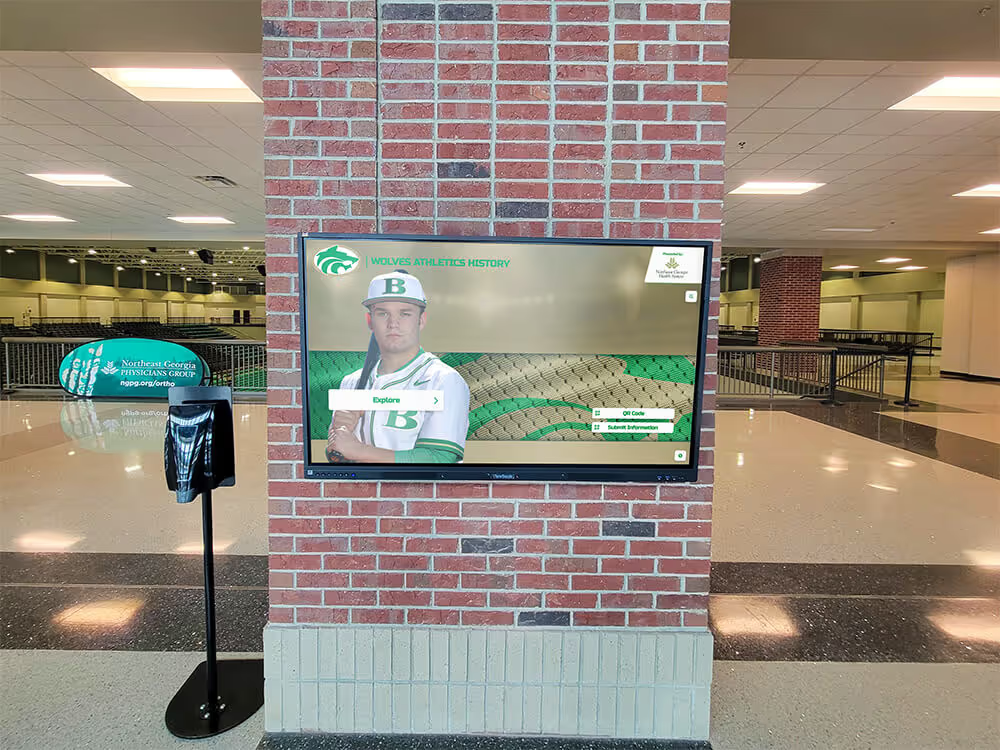
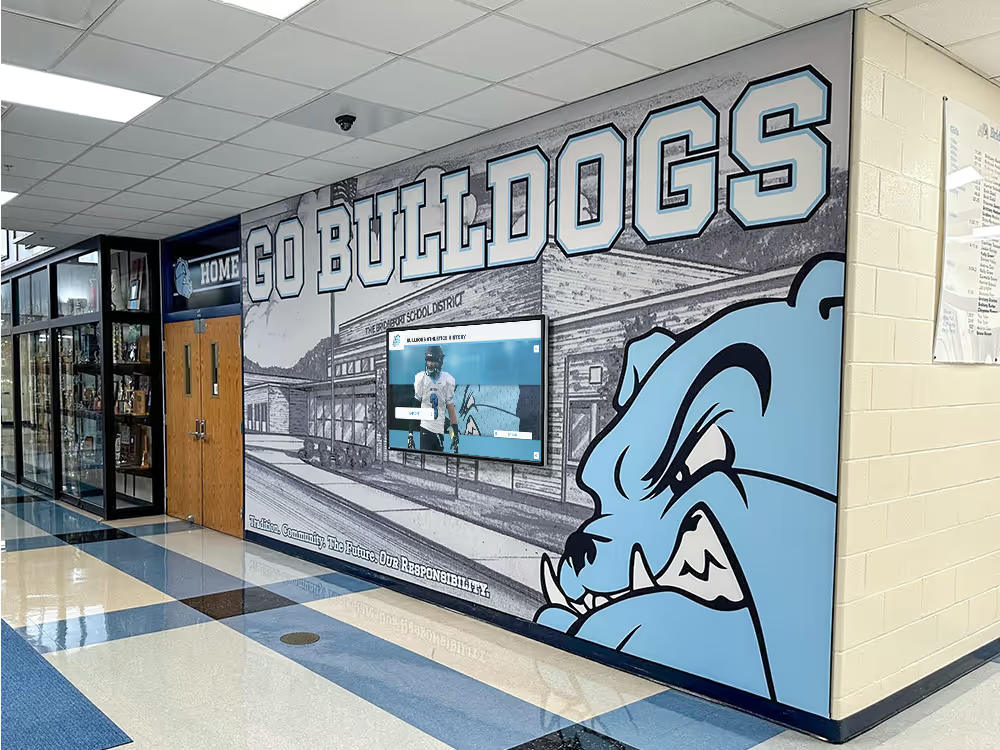
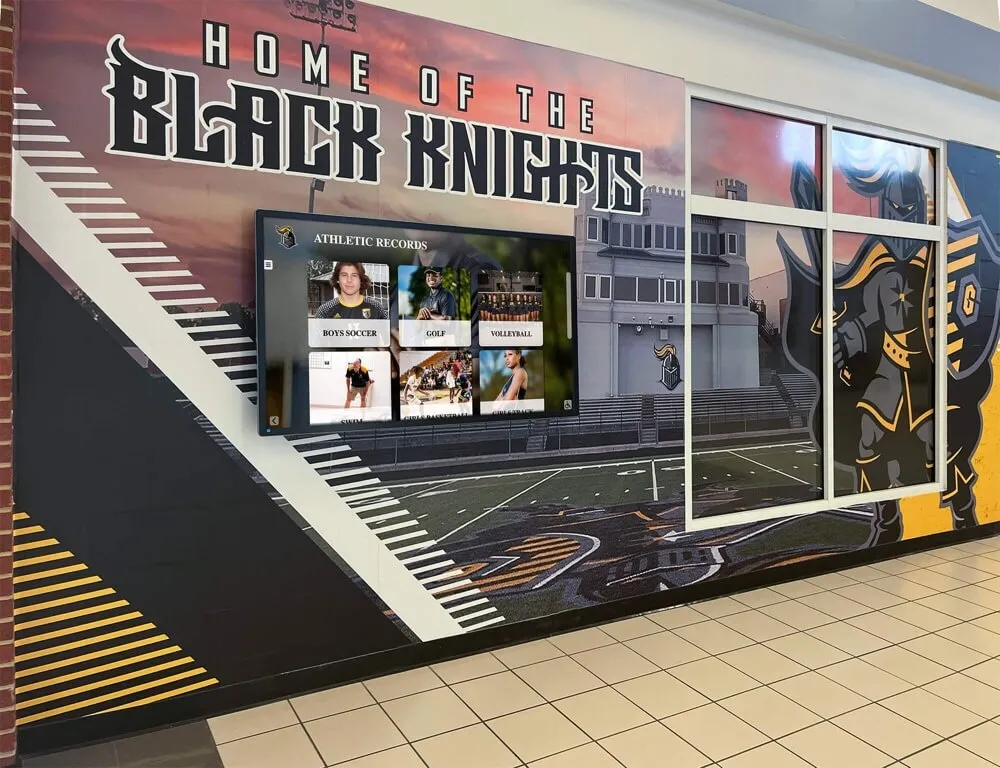
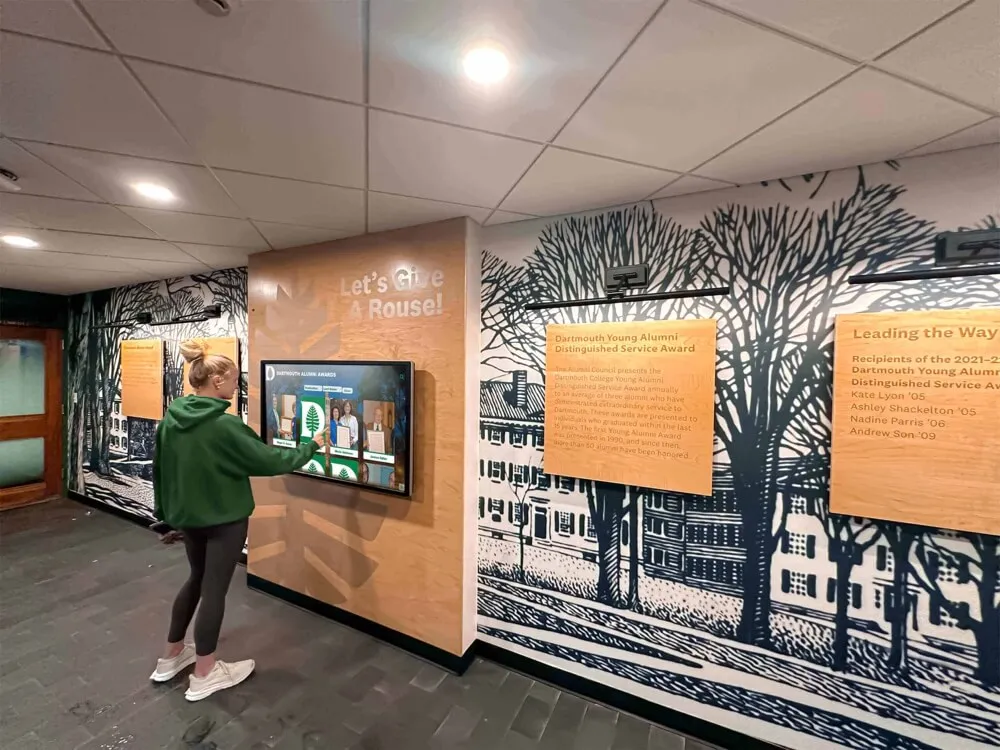
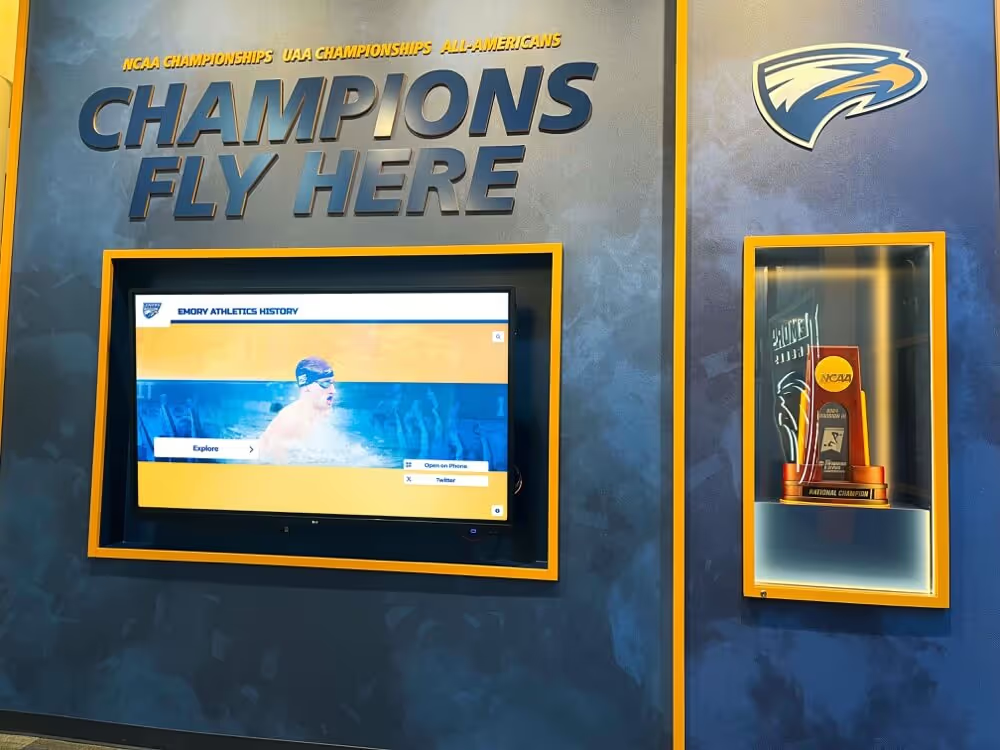
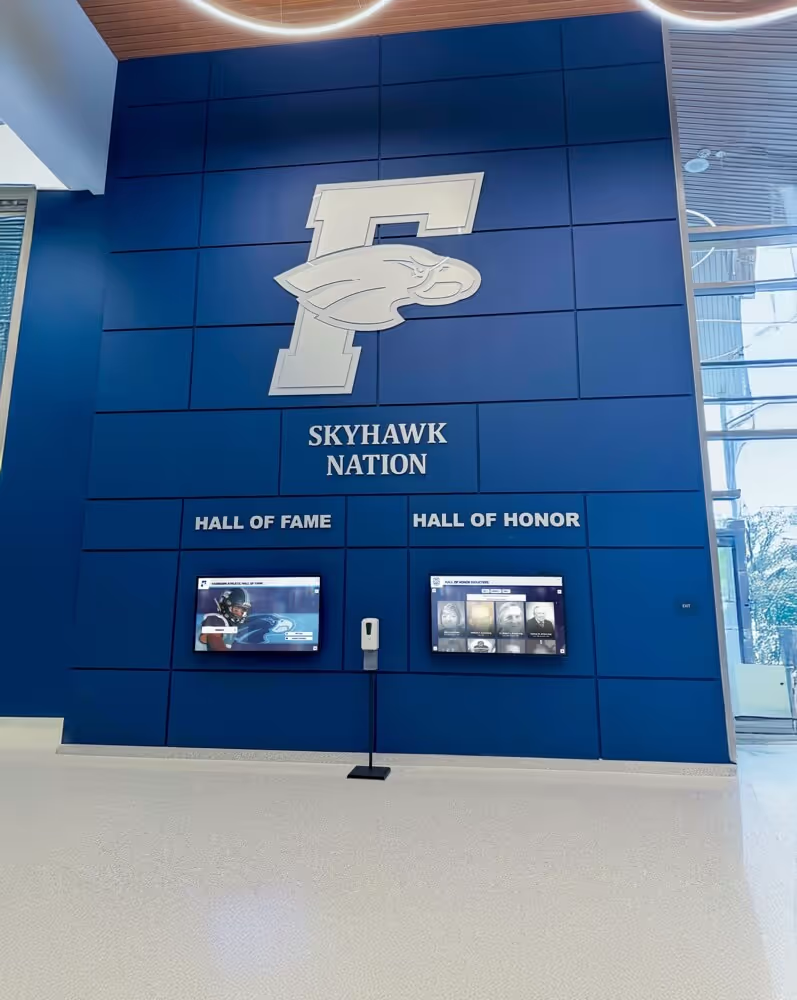
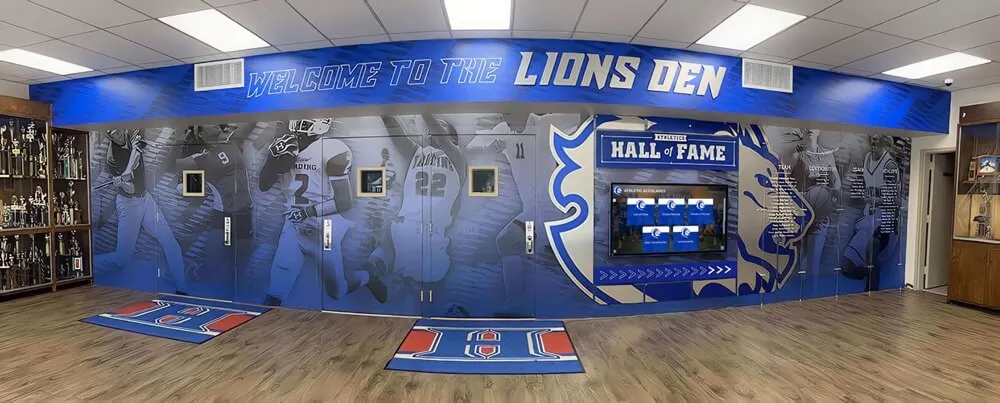
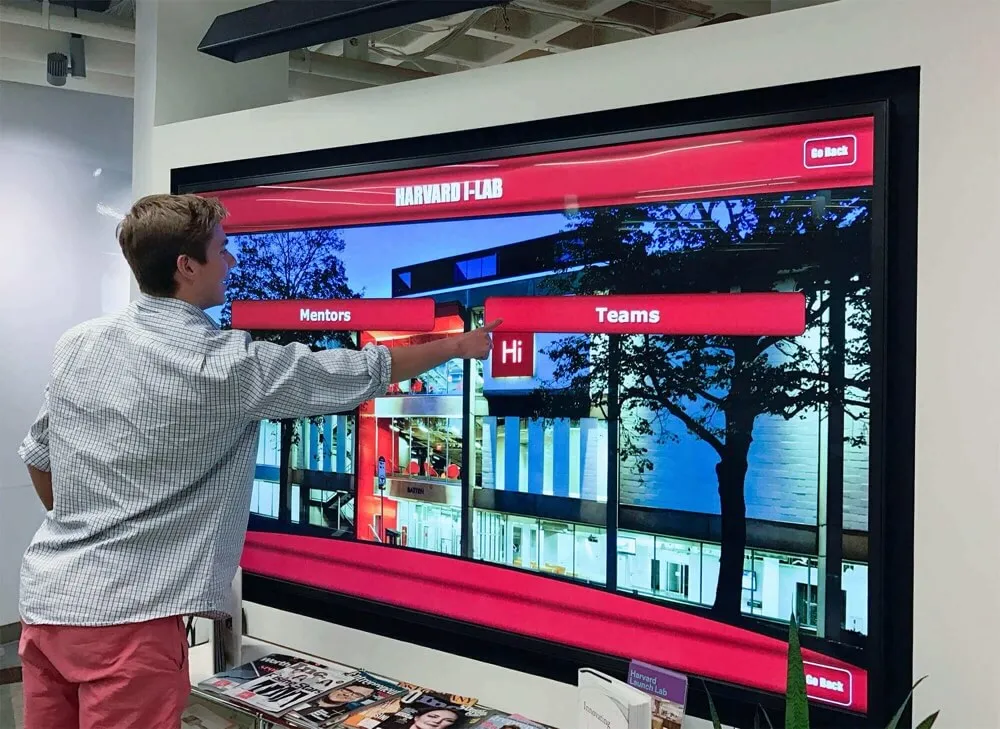
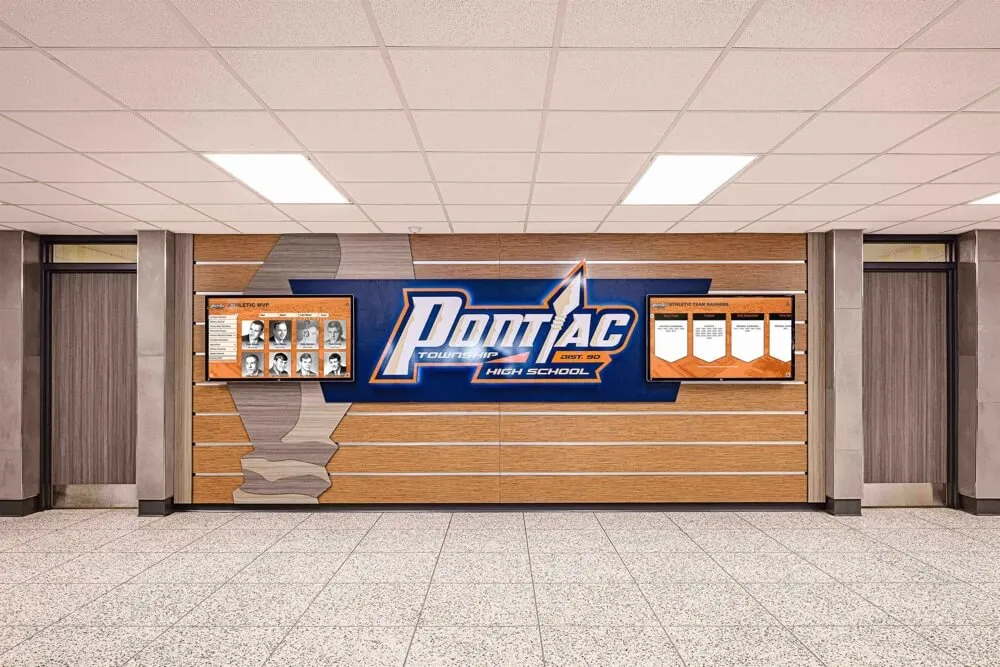
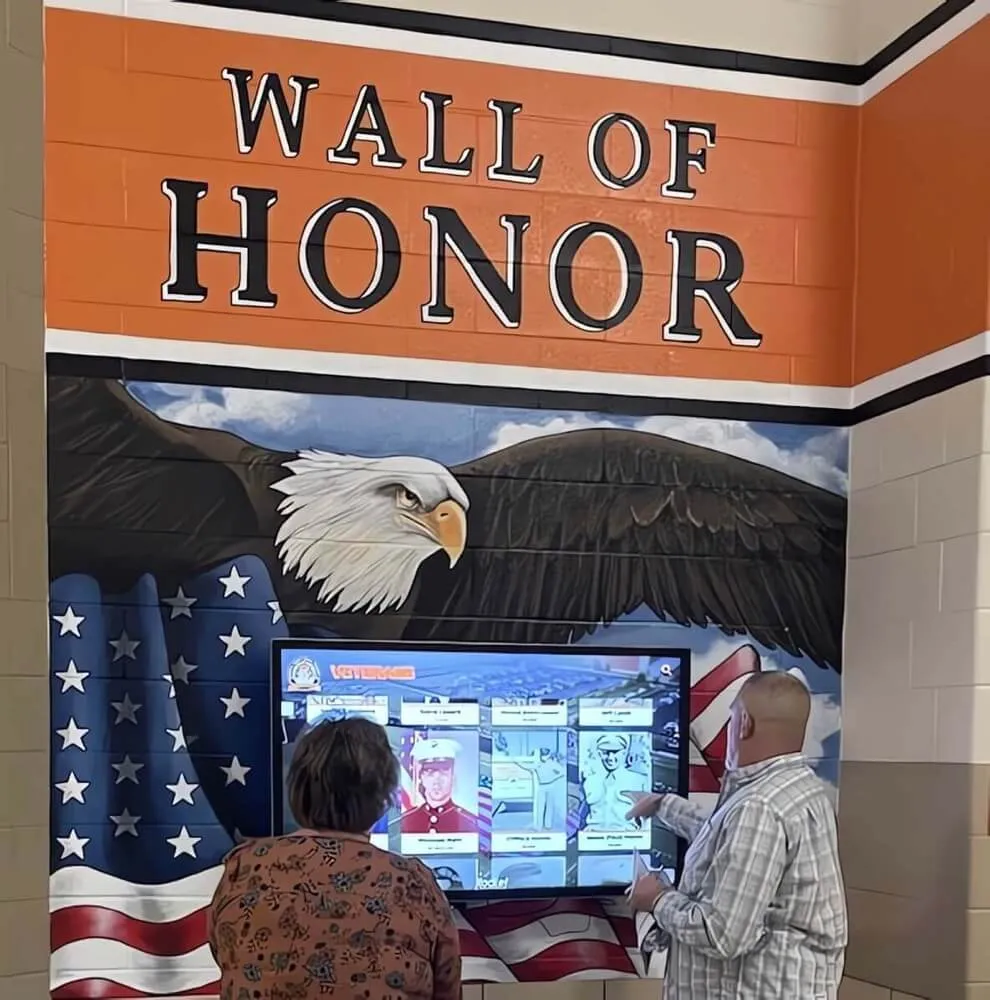
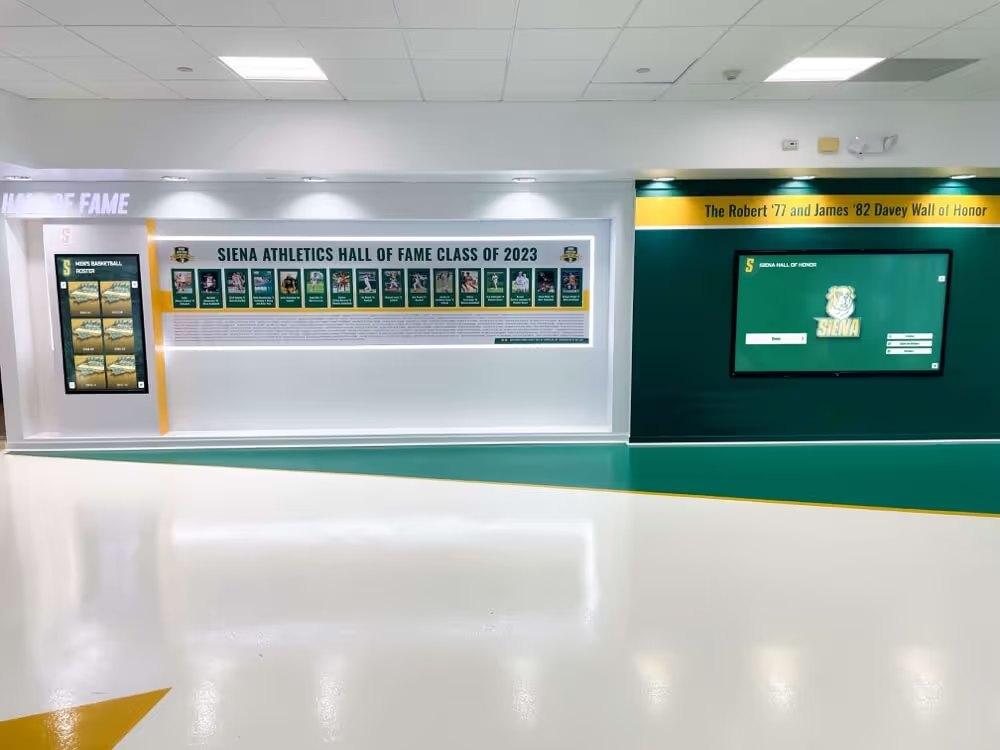
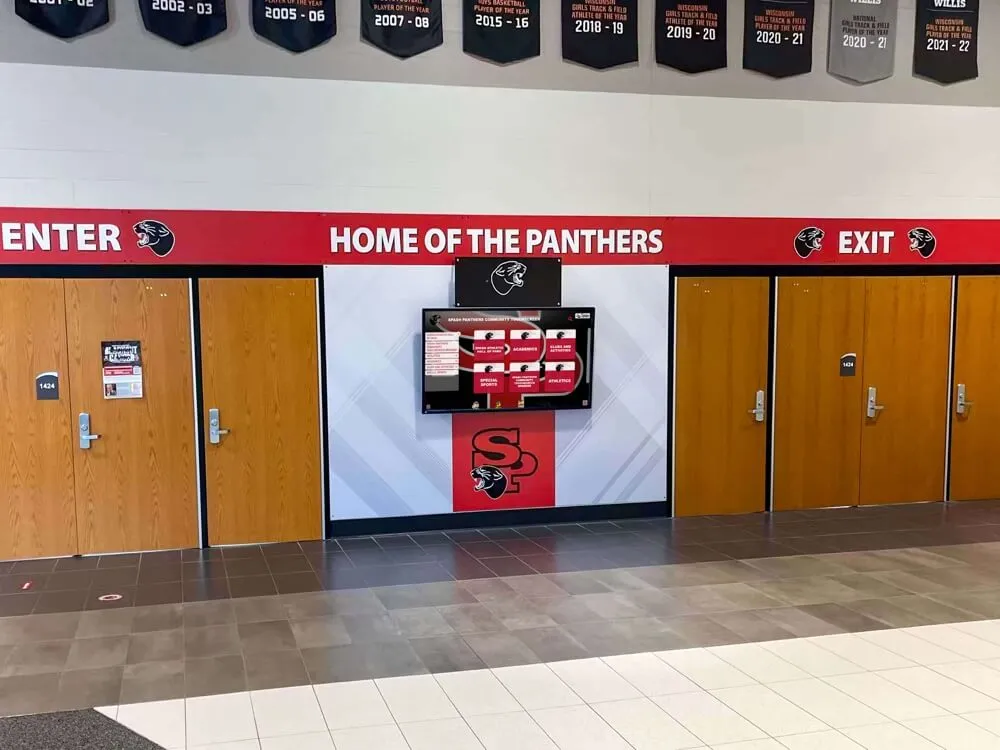
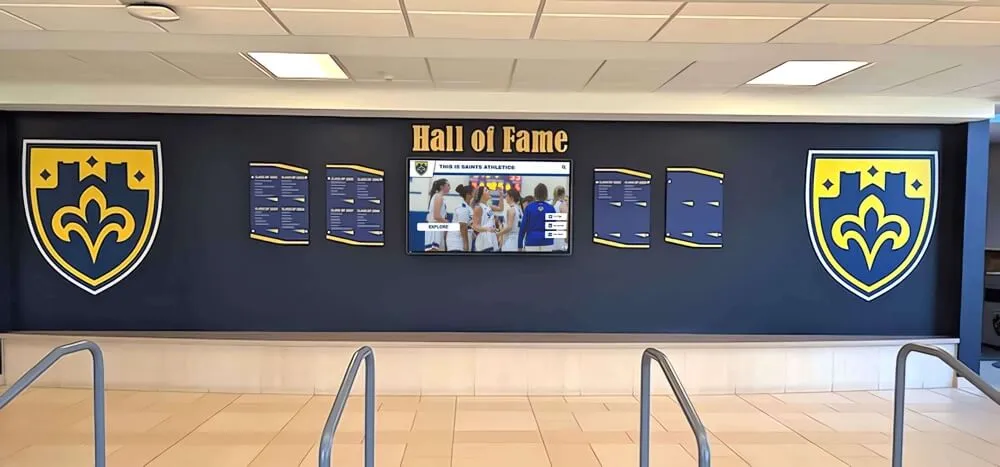
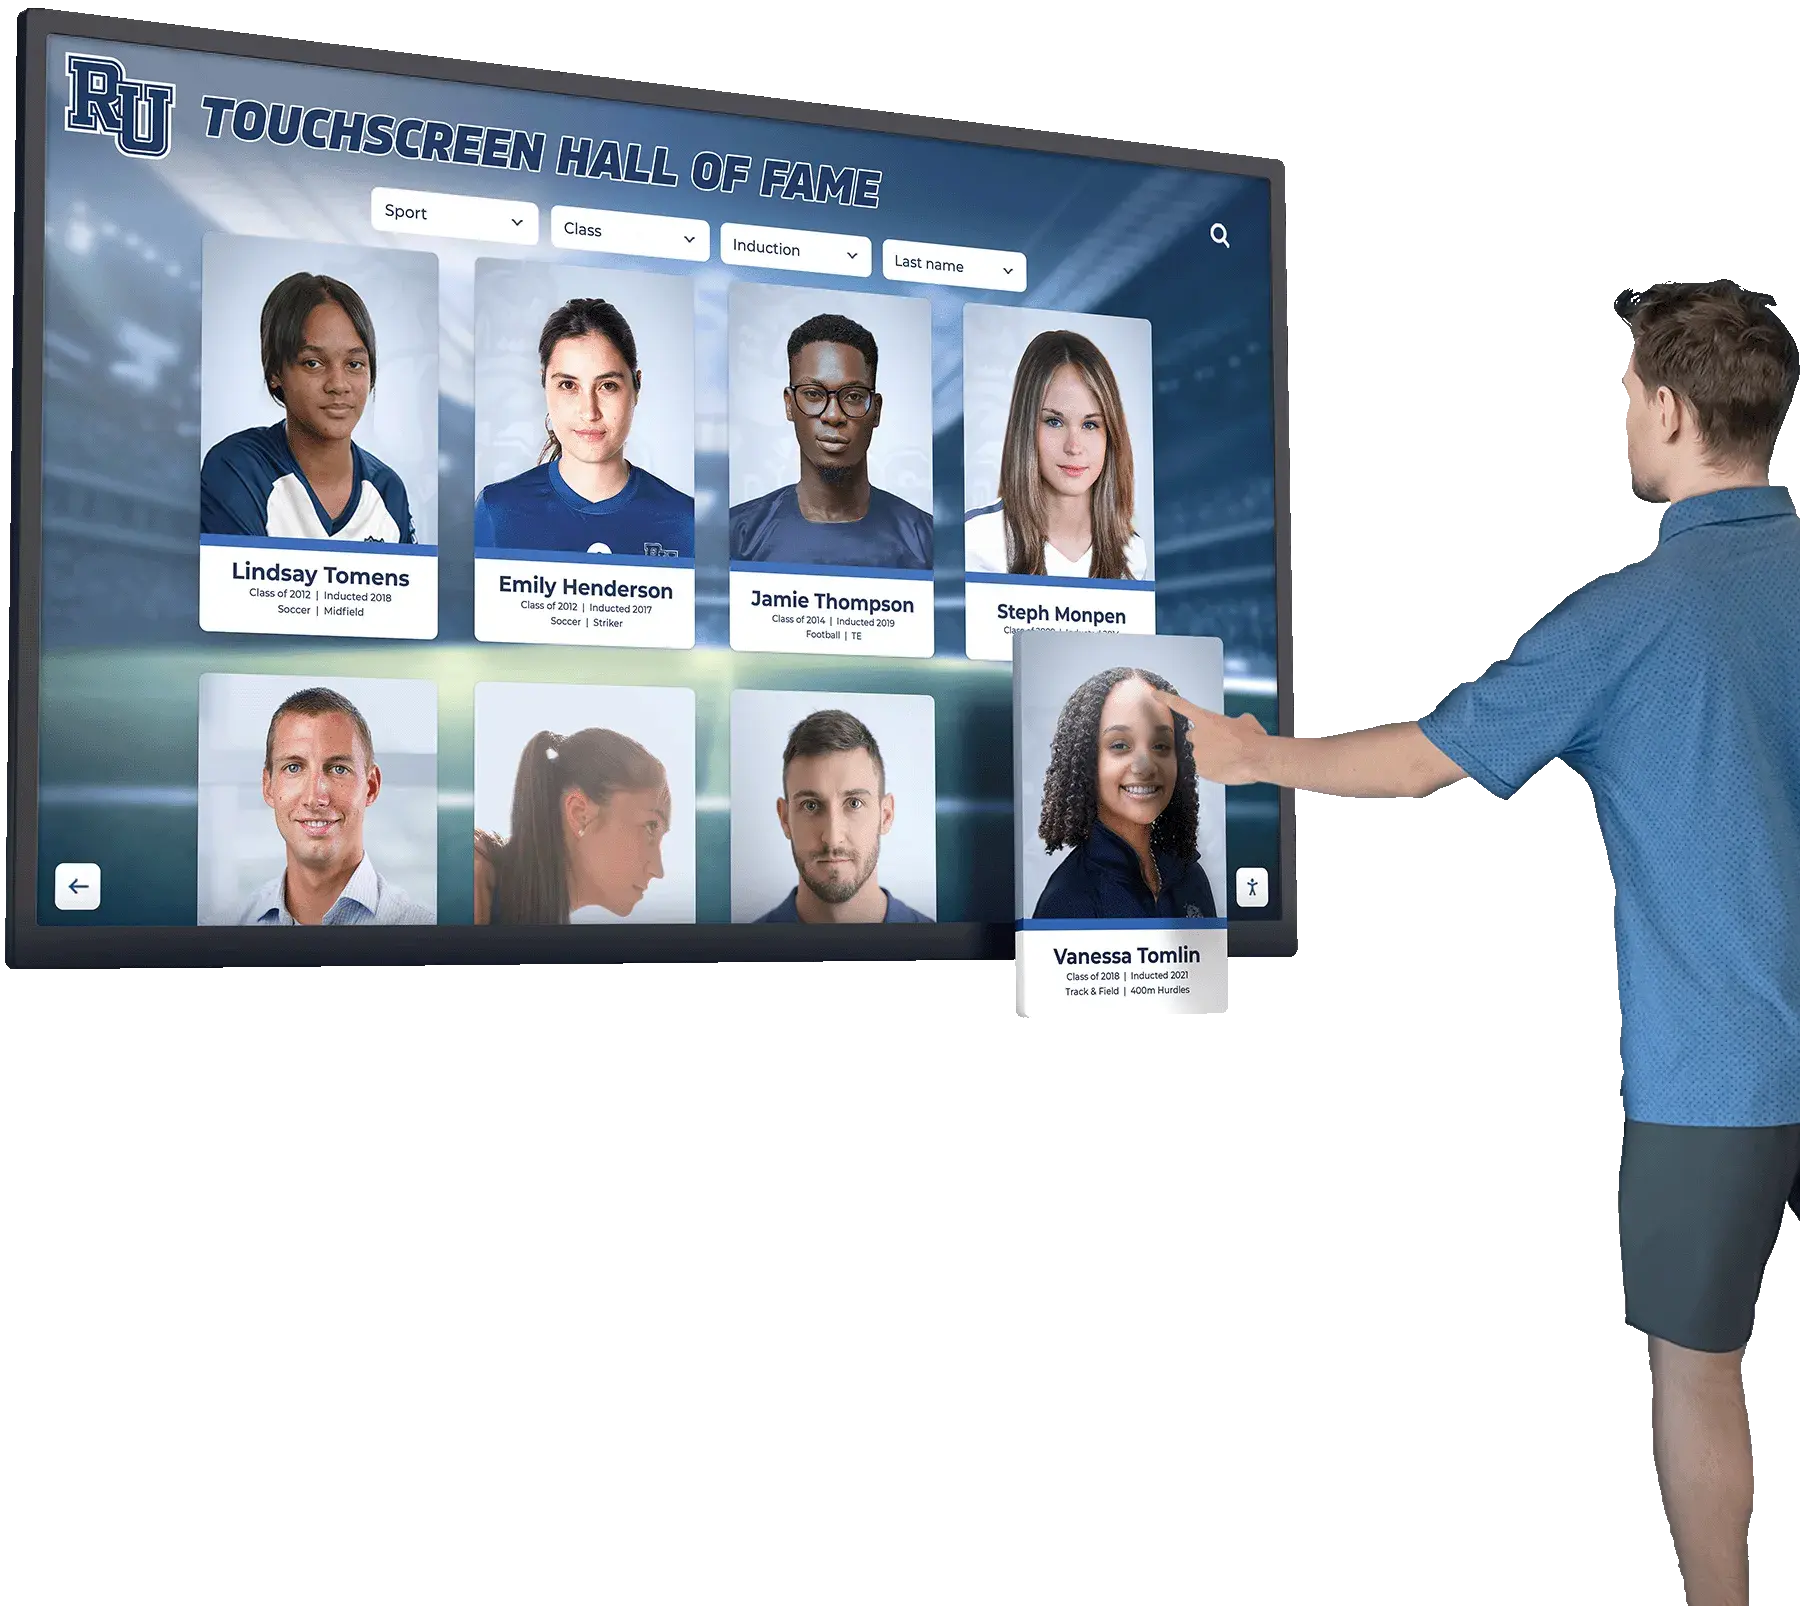
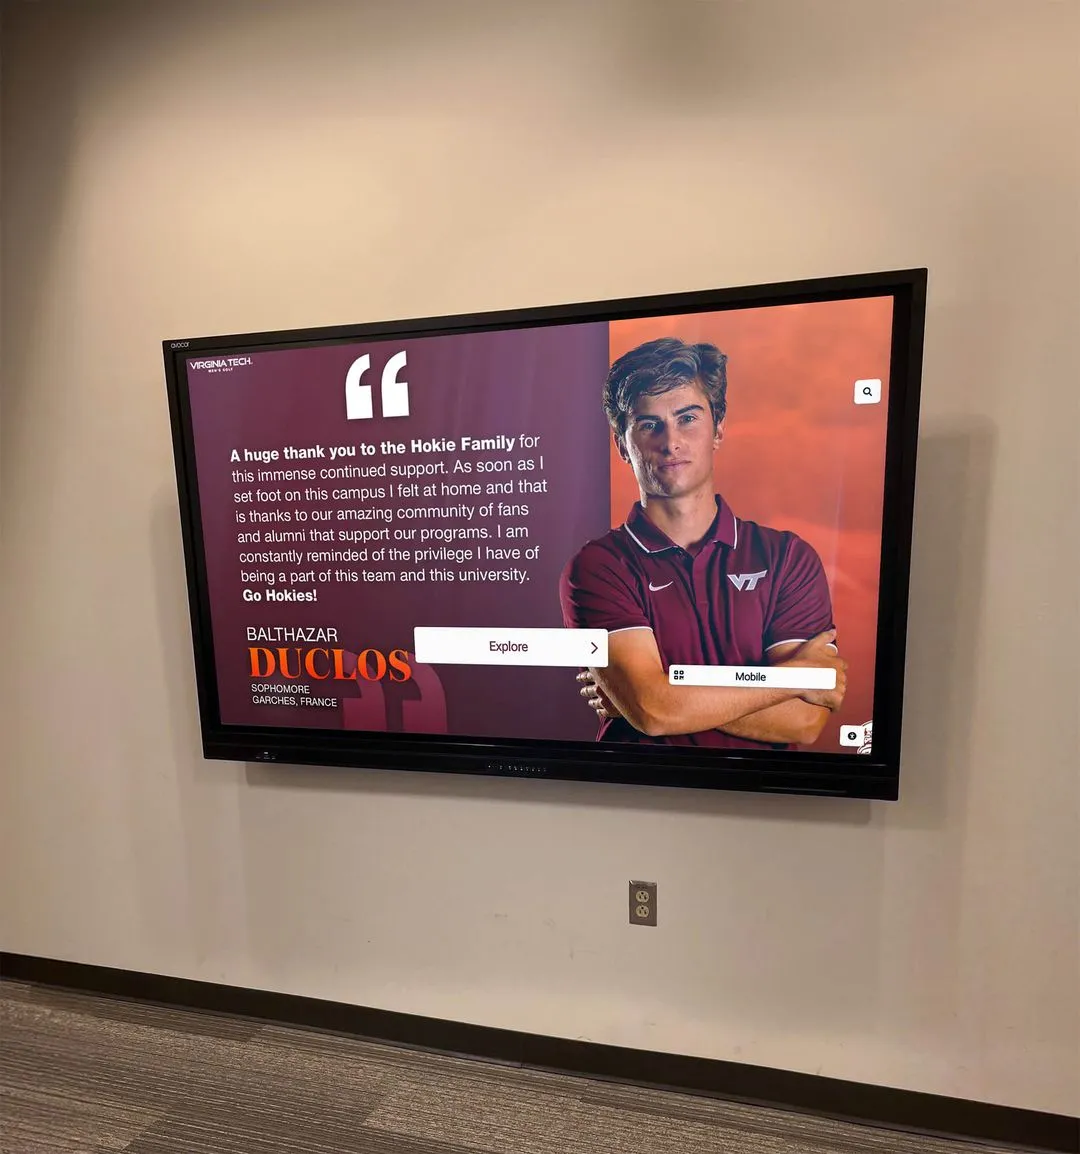
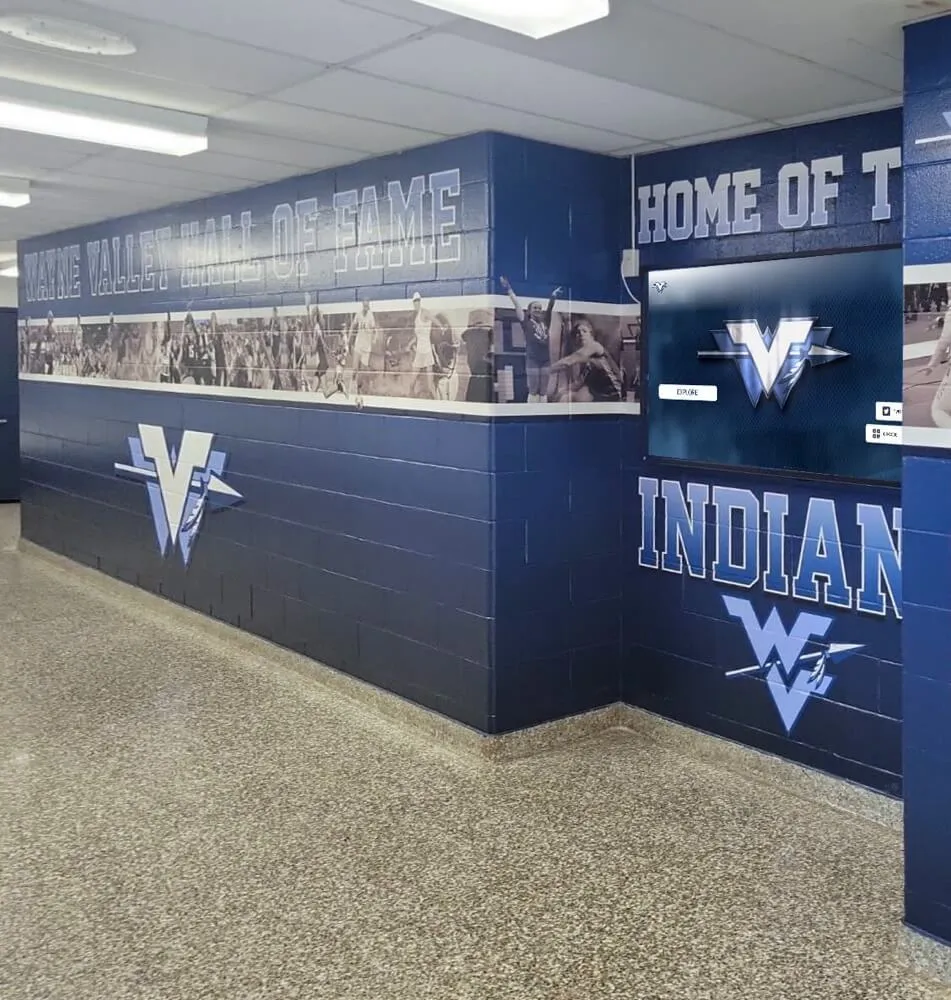
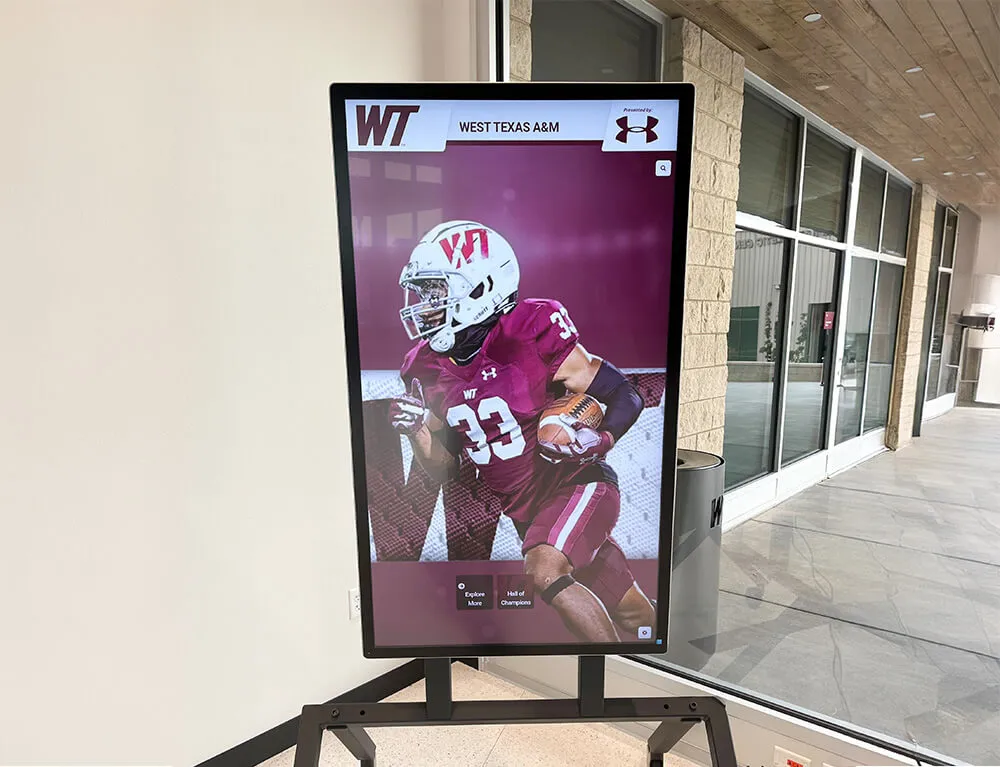
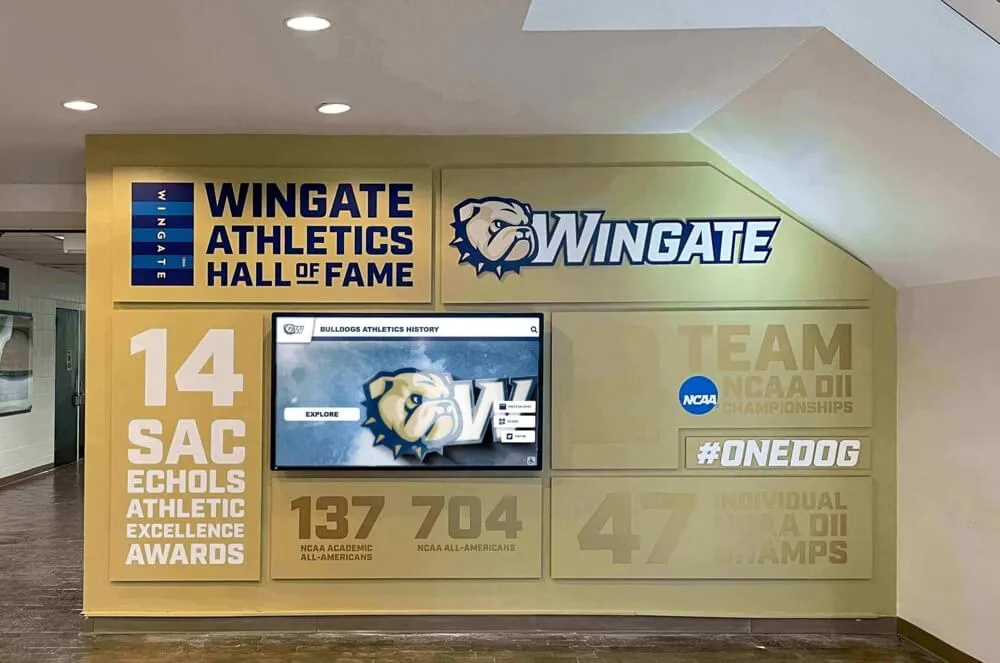
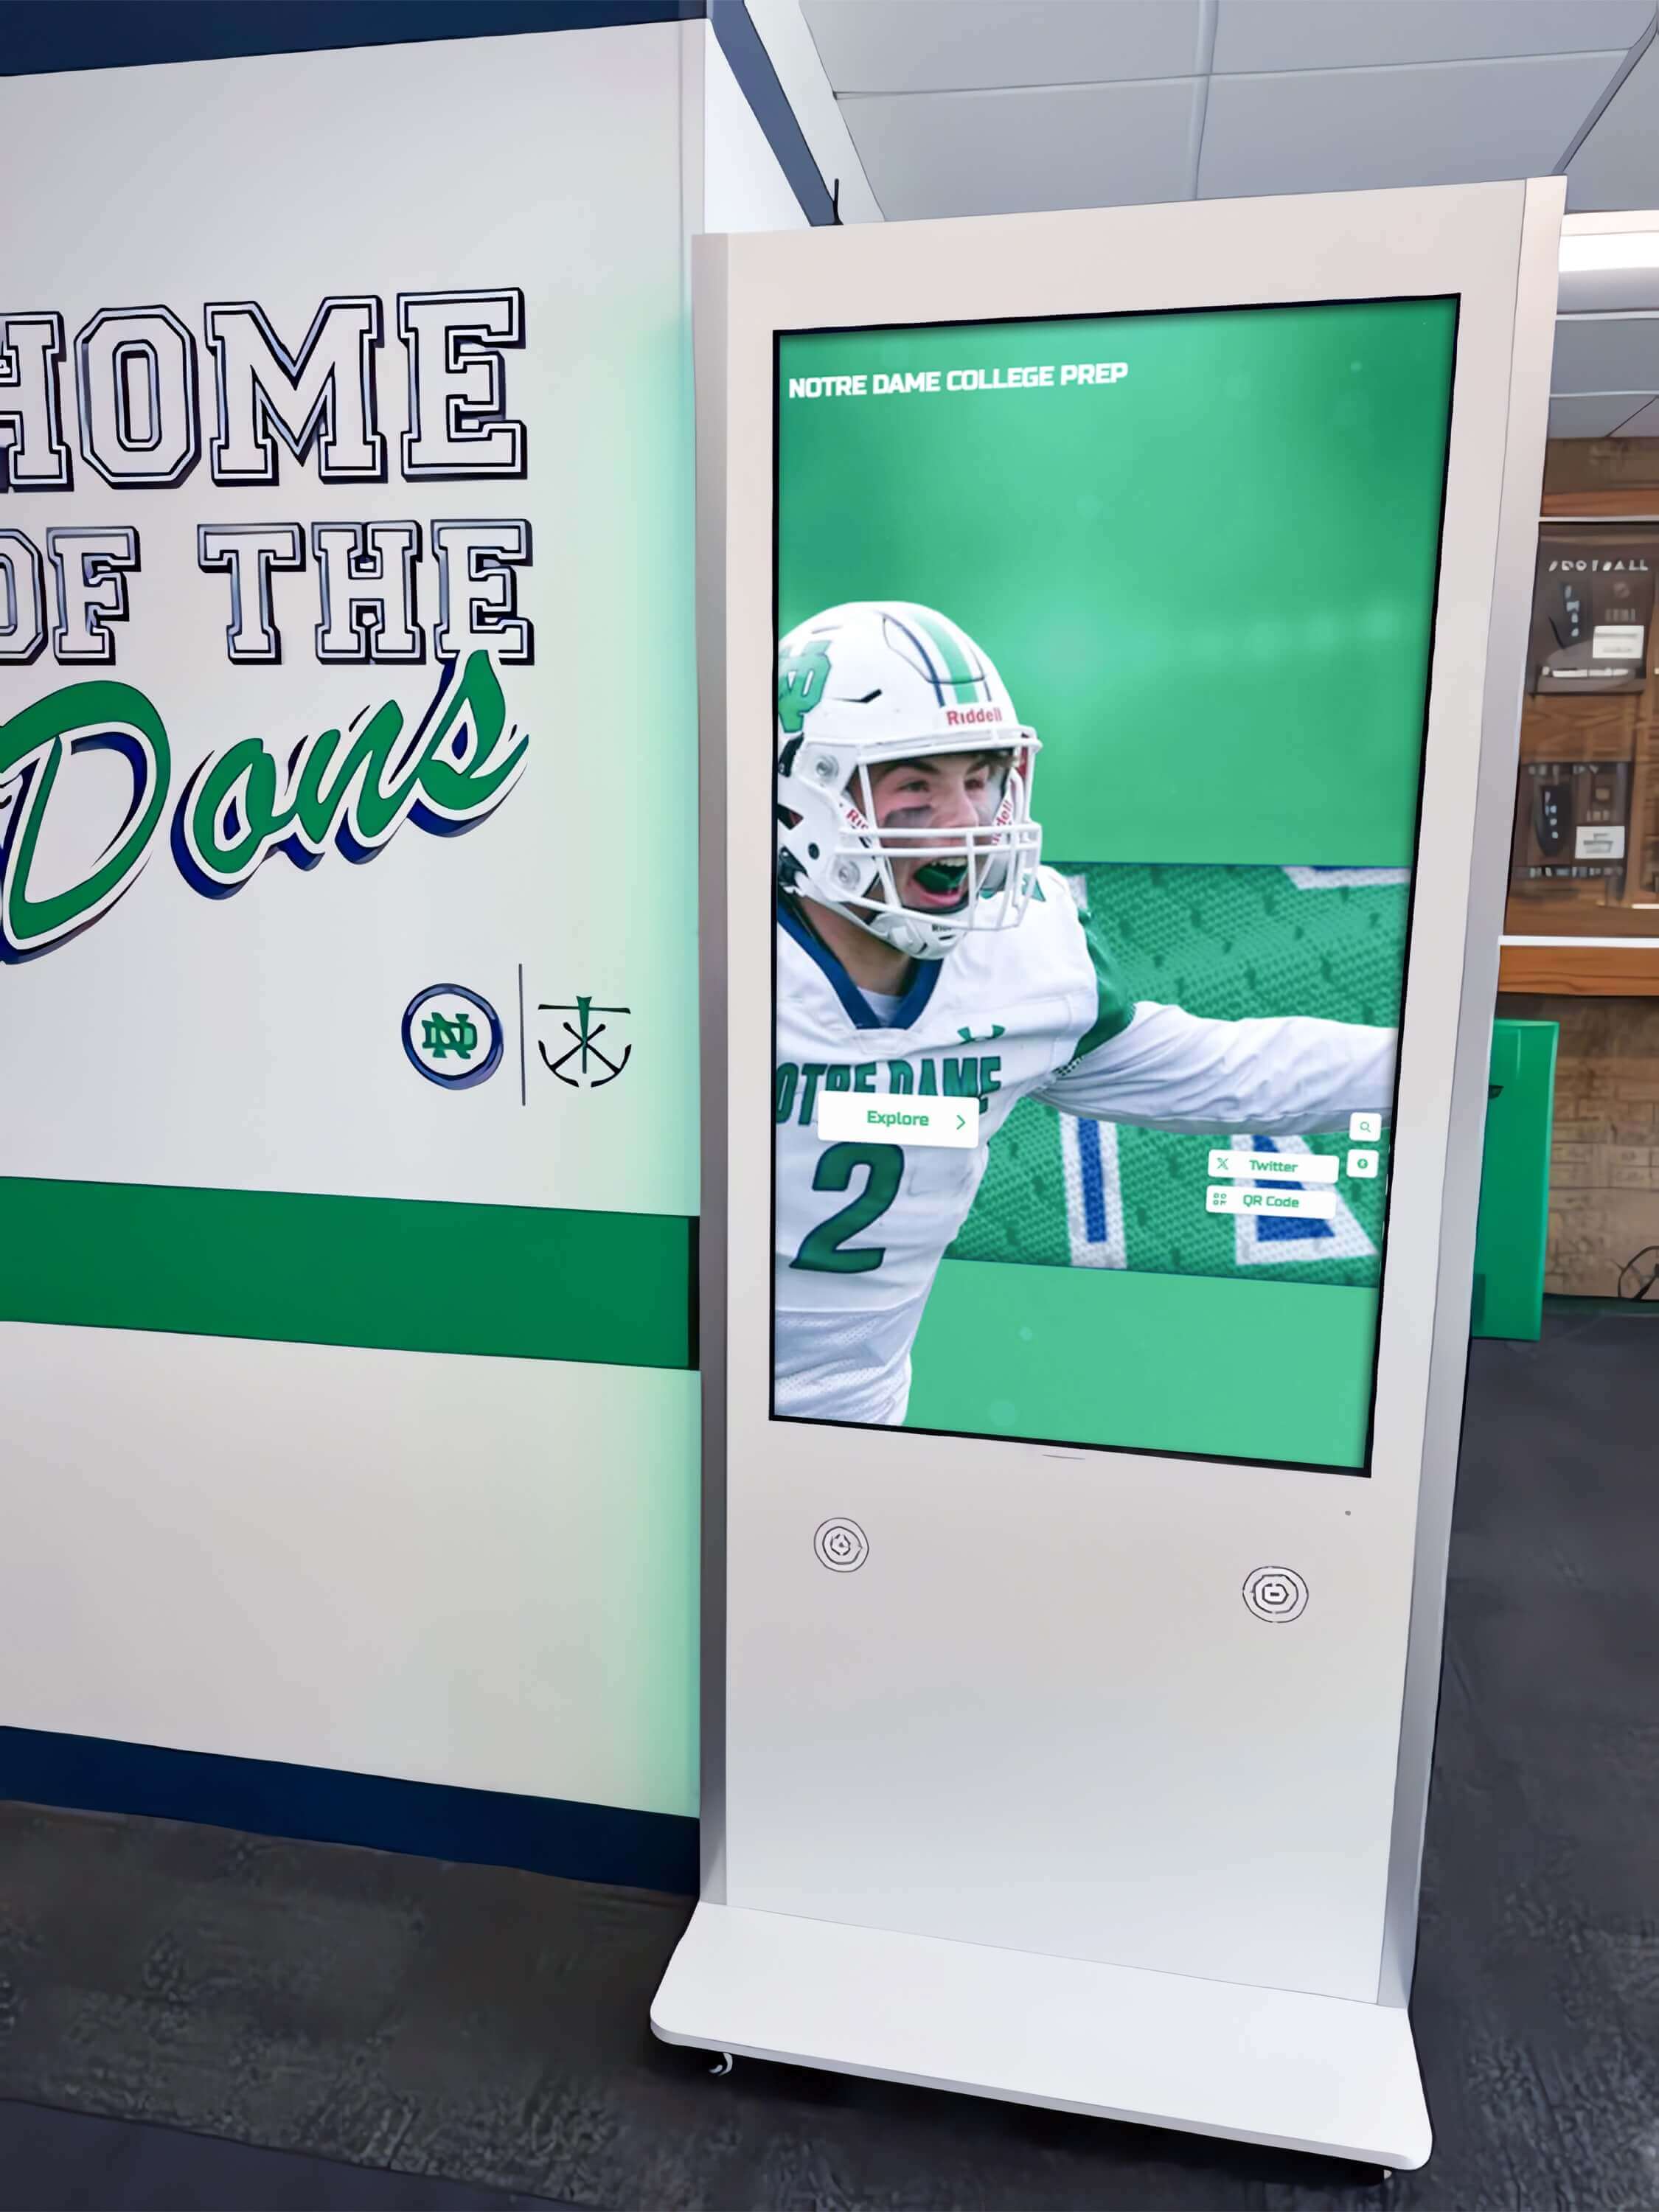
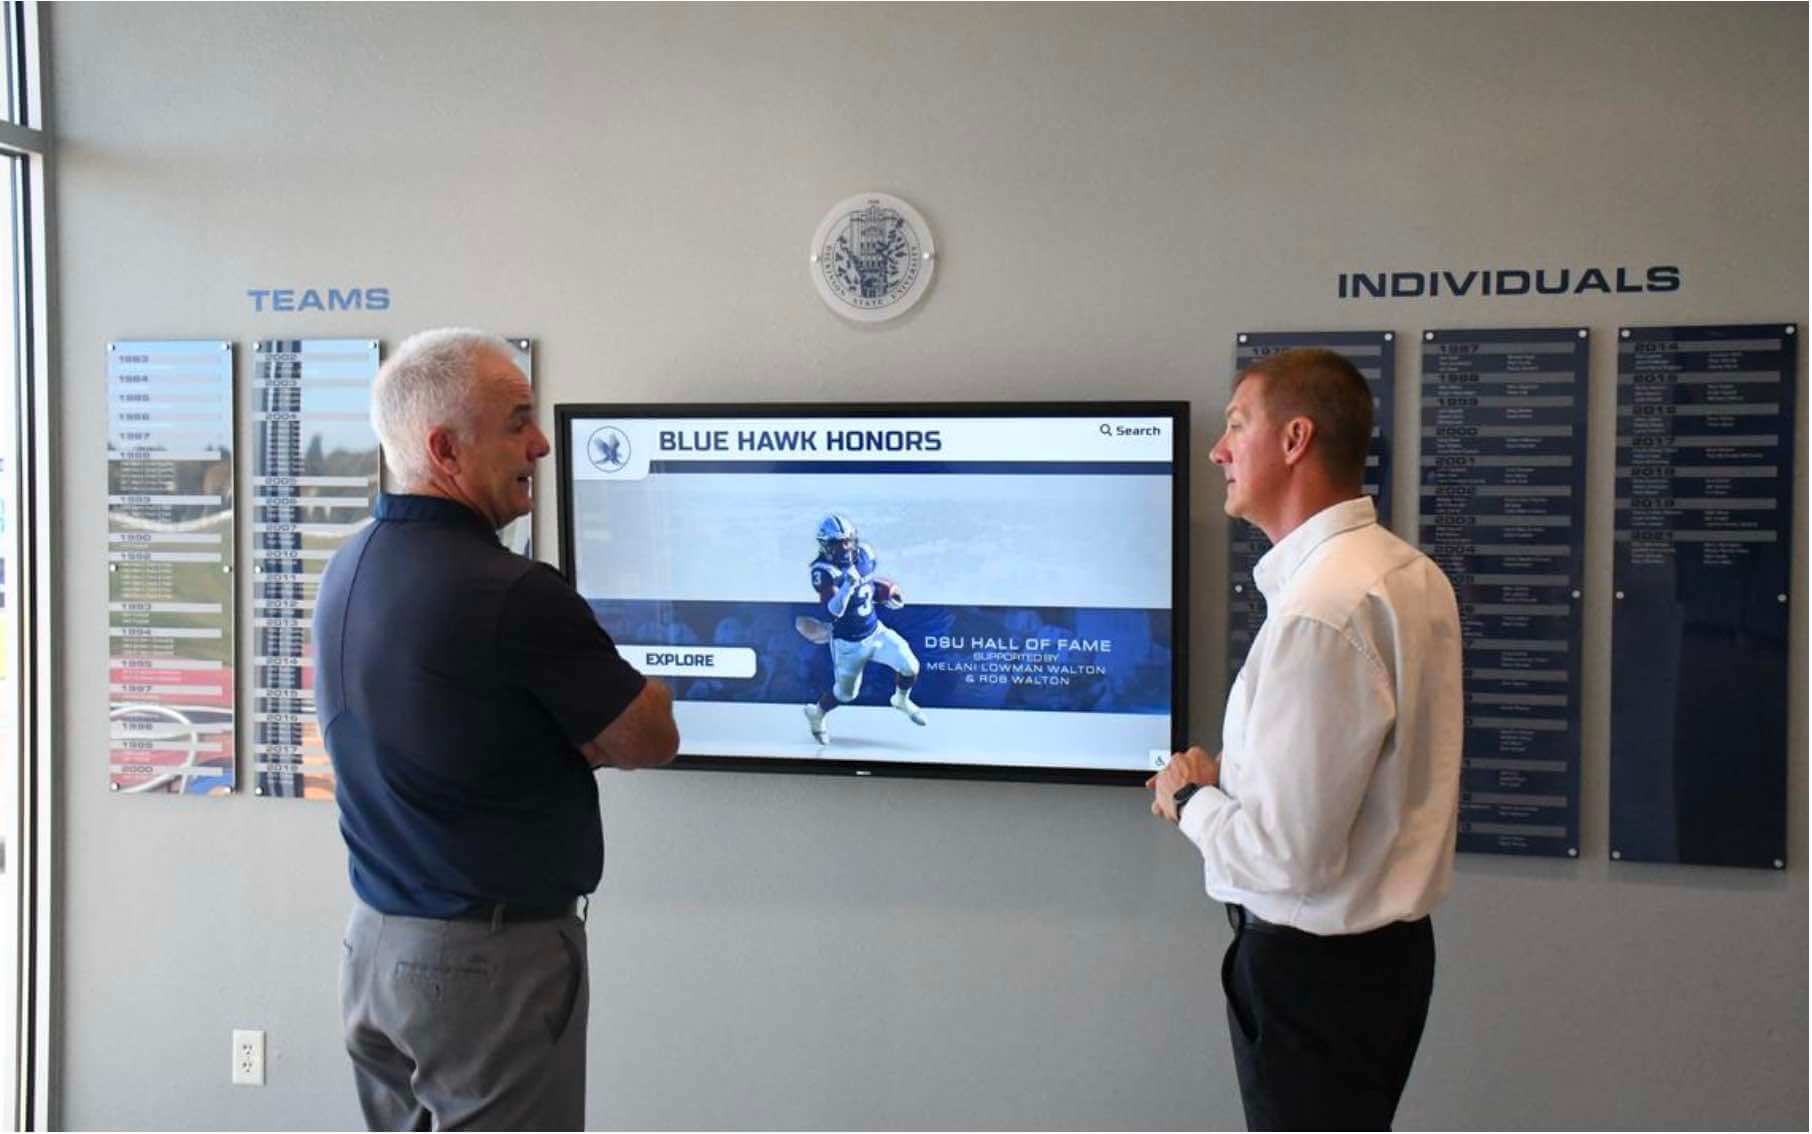
A school orders a touchscreen recognition display for the main lobby, the installer mounts it, IT connects it to the nearest guest Wi-Fi SSID, and it works fine during Tuesday afternoon setup. Then the hall of fame induction ceremony happens on Friday evening. Sixty guests arrive, all their phones associate to the same access point that the display is connected to, and the recognition display stalls mid-presentation while athletic portraits and highlight videos buffer endlessly. The hardware is fine. The CMS is fine. The wireless coverage at that exact location was never verified under realistic event conditions before the mount went into the wall.
A touchscreen recognition display wireless site survey checklist gives school IT coordinators, network administrators, and facilities staff a structured process for measuring signal strength, identifying interference sources, testing AP capacity under event load, validating roaming behavior between access points, and confirming network placement before the display arrives on site. Running this survey before installation day prevents surprises that are expensive to fix after the mount holes are drilled.
Nothing in this article is a substitute for a formal wireless site survey by a certified wireless network engineer. Schools with complex multi-building infrastructure, E-rate funded networks, or active district cybersecurity mandates should involve qualified IT leadership before making infrastructure changes.
The short answer: walk the proposed display location with a site survey tool, confirm RSSI of −65 dBm or better and SNR of 20 dB or better from the serving AP, verify the AP’s channel utilization is below 60% under a realistic concurrent device count, test roaming handoff at the boundary of the installation zone, and confirm the display will land on a dedicated VLAN with a QoS policy before any mounting work begins. The full checklist, measurement reference table, and phase-by-phase steps follow.
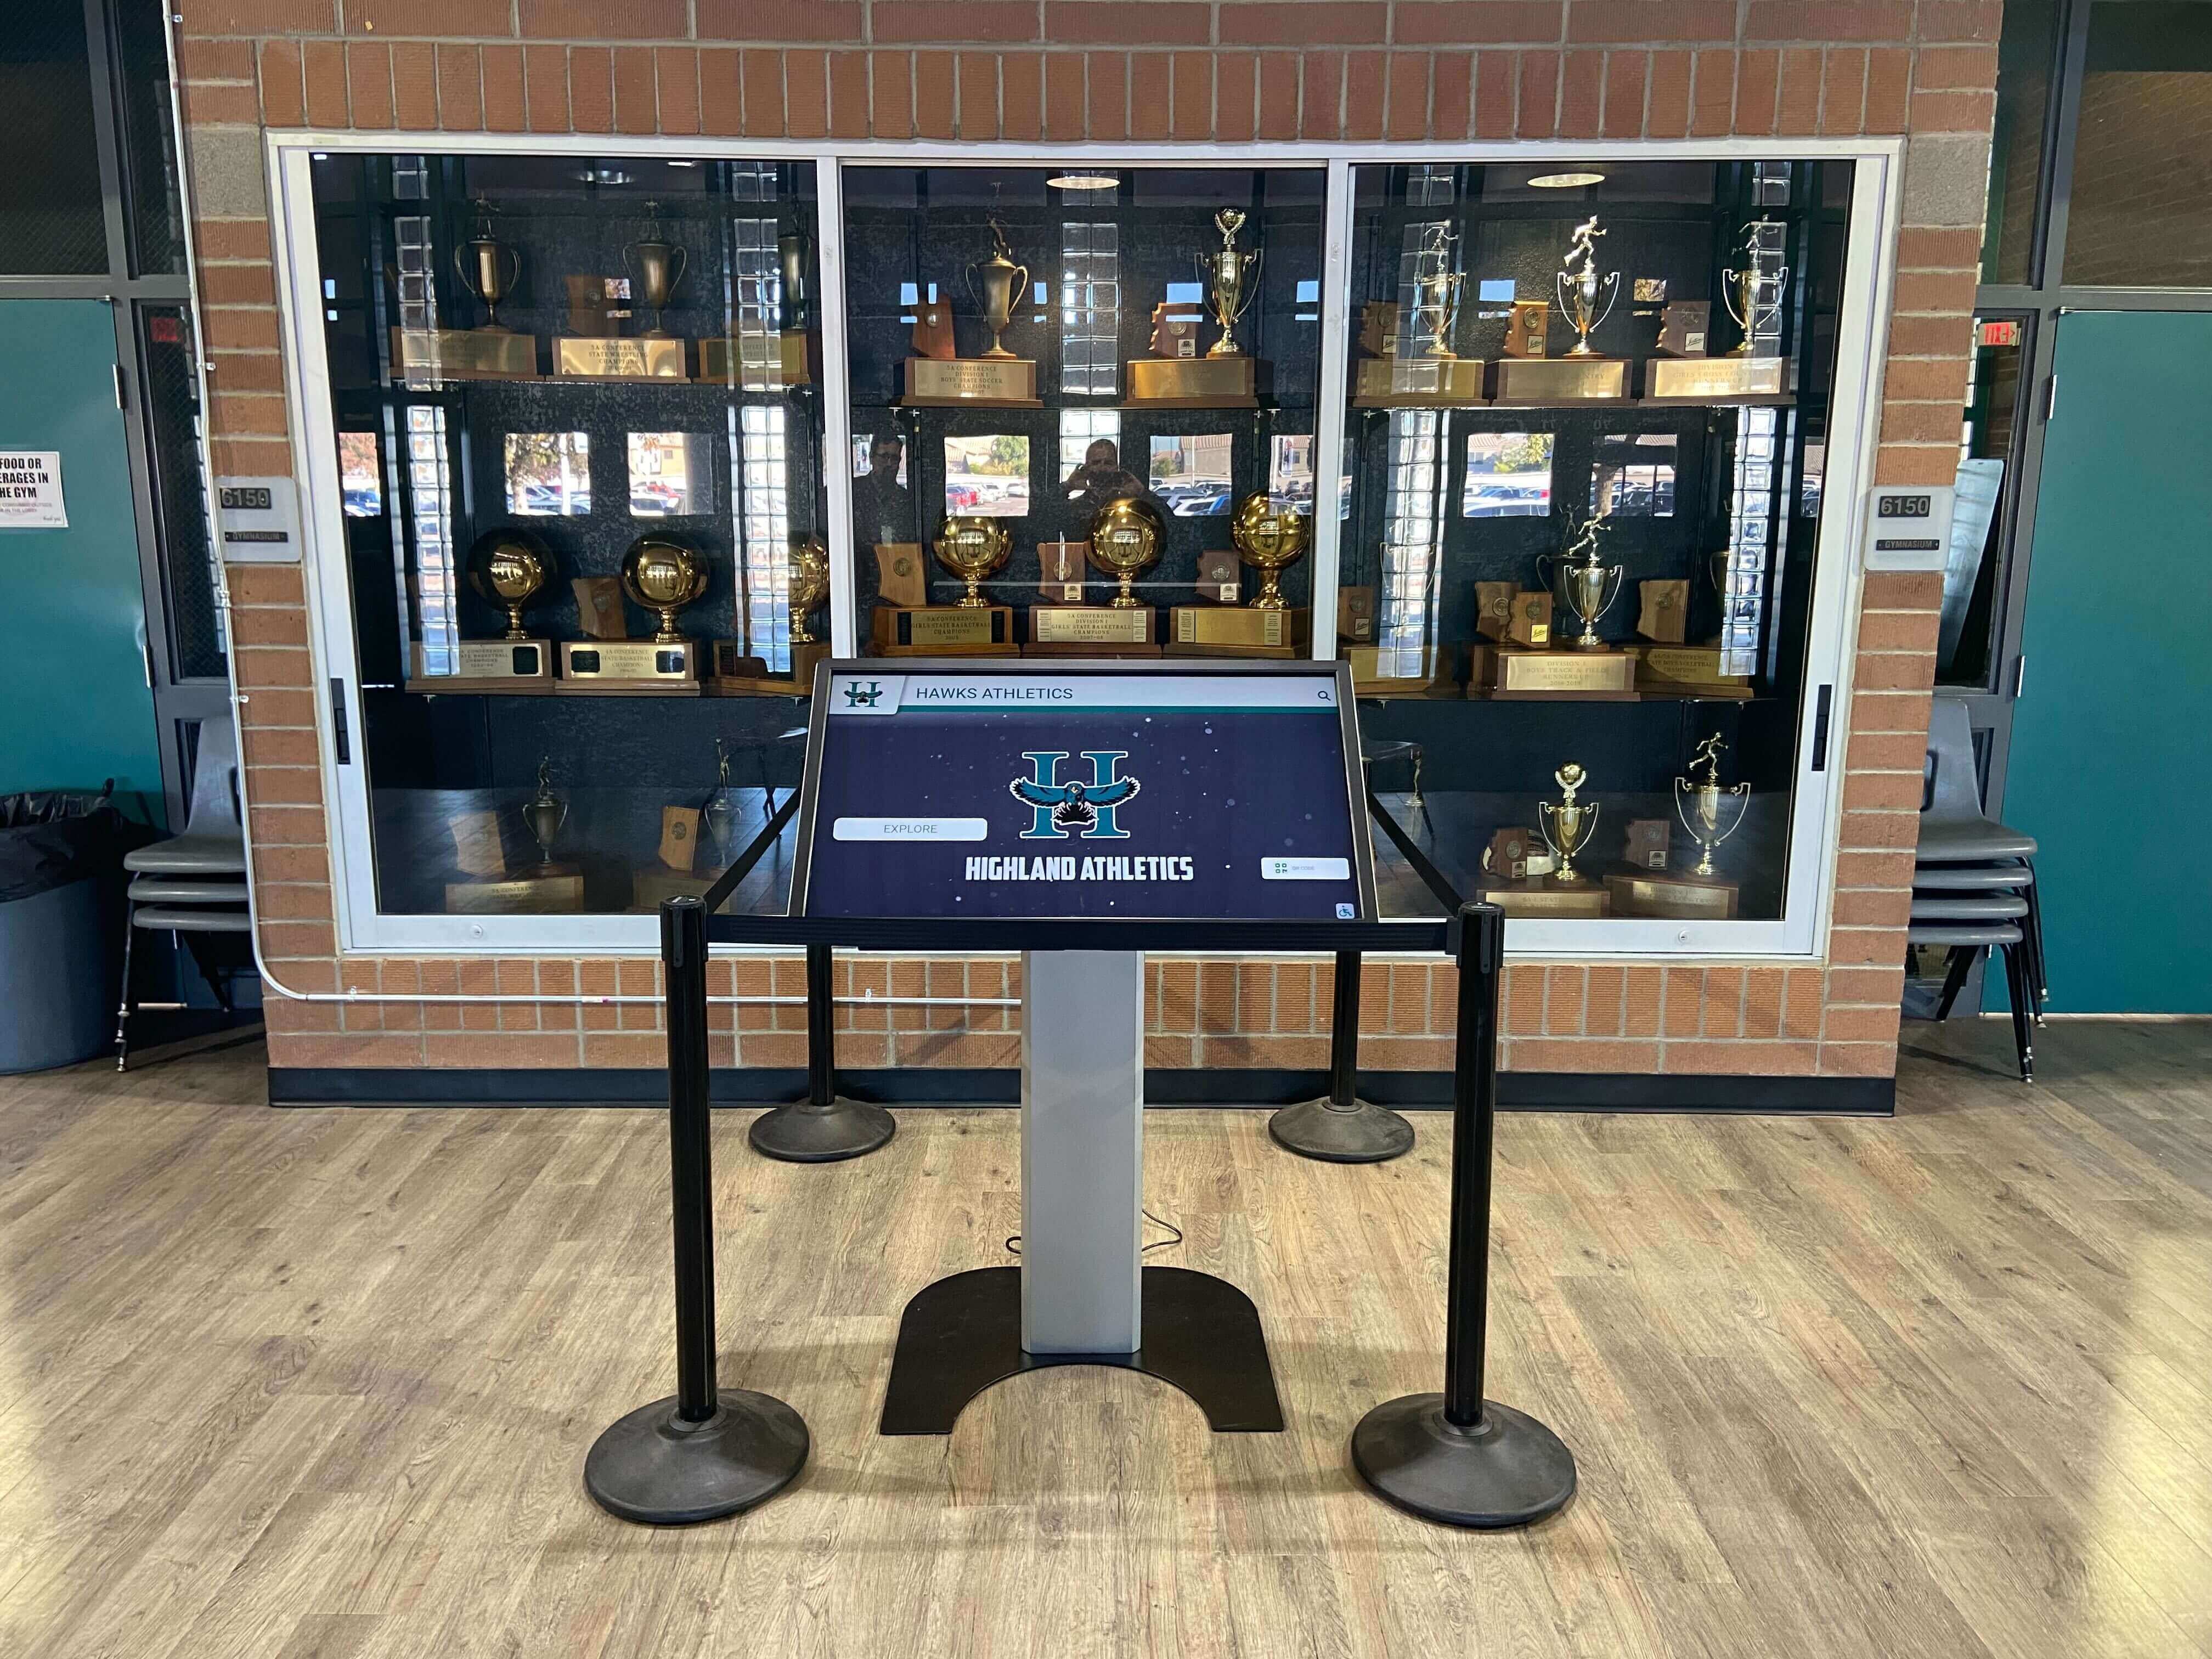
Wireless Site Survey Master Checklist
Use this table as your working document. Assign each item to a responsible role before Phase 1 begins. Store the completed checklist in the display’s installation file and revisit it before any AP firmware upgrade, building reconfiguration, or new recognition display deployment.
| Checklist Item | Phase | Owner | Status | Review Trigger |
|---|---|---|---|---|
| Identify exact mounting location with facilities manager | Preparation | Facilities + IT | ☐ Pending | At project kickoff |
| Confirm whether wired Ethernet is available at the mounting location | Preparation | IT Coordinator | ☐ Pending | At project kickoff |
| Document AP model, firmware version, and band capabilities at the installation zone | Preparation | Network Administrator | ☐ Pending | After any AP change |
| Identify all SSIDs and VLANs currently active on APs covering the zone | Preparation | Network Administrator | ☐ Pending | After any SSID change |
| Gather site survey tool capable of recording RSSI, SNR, and channel utilization | Preparation | IT Coordinator | ☐ Pending | Before each survey |
| Walk the installation zone and record RSSI from the serving AP at the display mount point | Signal Strength | IT Coordinator | ☐ Pending | Before installation |
| Record RSSI at 1 m, 3 m, and 5 m from the mount point in each direction | Signal Strength | IT Coordinator | ☐ Pending | Before installation |
| Confirm RSSI is −65 dBm or better at the mount point (−70 dBm minimum threshold) | Signal Strength | IT Coordinator | ☐ Pending | Before installation |
| Record SNR at the mount point — confirm 20 dB or better | Signal Strength | IT Coordinator | ☐ Pending | Before installation |
| Confirm the display’s AP operates on 5 GHz (or 6 GHz if Wi-Fi 6E is available) | Signal Strength | Network Administrator | ☐ Pending | Before installation |
| Identify all neighboring APs visible at the mount point and record their signal levels | Interference | IT Coordinator | ☐ Pending | Before installation |
| Scan 2.4 GHz channels 1, 6, and 11 for co-channel and adjacent-channel interference | Interference | IT Coordinator | ☐ Pending | Before installation |
| Scan 5 GHz channels in use by neighboring APs — confirm non-overlapping channel assignment | Interference | IT Coordinator | ☐ Pending | Before installation |
| Identify any non-Wi-Fi interference sources: microwaves, Bluetooth, DECT phones, neighboring schools | Interference | IT Coordinator | ☐ Pending | Before installation |
| Record channel utilization on the serving AP during a representative high-load period | Interference | IT Coordinator | ☐ Pending | Before installation |
| Confirm channel utilization is below 60% during peak school-day traffic | Interference | Network Administrator | ☐ Pending | Before installation |
| Estimate maximum concurrent device count at the installation zone during a typical event | Capacity | IT Coordinator | ☐ Pending | Before installation |
| Associate test devices to the zone AP and confirm throughput with video playback active | Capacity | IT Coordinator | ☐ Pending | Before installation |
| Confirm display connection does not degrade when 20+ guest devices associate to zone APs | Capacity | IT Coordinator | ☐ Pending | Before each major event |
| Walk from the installation zone toward adjacent zones and record roaming handoff points | Roaming | IT Coordinator | ☐ Pending | Before installation |
| Confirm seamless handoff — no content pause longer than 2 seconds during AP transition | Roaming | IT Coordinator | ☐ Pending | Before installation |
| Verify 802.11r (fast BSS transition) or equivalent is enabled if the display roams during a session | Roaming | Network Administrator | ☐ Pending | Before installation |
| Assign the display to a dedicated display VLAN — do not share with student or guest SSIDs | Network Placement | Network Administrator | ☐ Pending | At installation |
| Confirm static IP or DHCP reservation is configured for the display’s MAC address | Network Placement | Network Administrator | ☐ Pending | At installation |
| Confirm QoS policy is active on the display VLAN, prioritizing CMS video and API traffic | Network Placement | Network Administrator | ☐ Pending | At installation |
| Validate DNS resolution for all CMS, CDN, and NTP domains from the display VLAN | Network Placement | IT Coordinator | ☐ Pending | Before installation |
| Confirm no captive portal intercepts traffic on the display’s network segment | Network Placement | Network Administrator | ☐ Pending | Before installation |
| Load a 1080p video from the CMS for 5 continuous minutes at the installed location | Pre-Installation | IT Coordinator | ☐ Pending | Before go-live |
| Run concurrent load test: 20+ guest devices active while display plays video | Pre-Installation | IT Coordinator | ☐ Pending | Before go-live |
| Document all survey findings in the display installation file | Documentation | IT Coordinator | ☐ Pending | After each survey |
Wireless Signal Measurement Reference Table
Use these values to evaluate the survey readings you record at the installation zone. A reading that falls below the minimum threshold indicates that the AP placement, AP power settings, or physical obstacles between the AP and the display location must be addressed before installation proceeds.
| Measurement | Target Value | Minimum Threshold | Action if Below Minimum |
|---|---|---|---|
| RSSI at mount point | −55 dBm or better | −70 dBm | Reposition AP, increase TX power, or add AP closer to display location |
| Signal-to-Noise Ratio (SNR) | 25 dB or better | 20 dB | Identify and mitigate interference sources; reposition AP if SNR is noise-limited |
| Retry rate on serving AP | Under 2% | Under 5% | Investigate interference or association density; reduce client load on AP |
| Channel utilization (5 GHz) | Under 40% at peak | Under 60% | Add AP to distribute load; reduce non-display clients on this AP |
| Received data rate at mount point | 54 Mbps or higher (effective) | 24 Mbps (effective) | Reduce distance to AP; address multipath; upgrade AP if rate-limited by client density |
| Roaming handoff time | Under 150 ms | Under 500 ms | Enable 802.11r; adjust roaming thresholds in AP controller |
| AP association density during event | Under 25 clients per AP | Under 40 clients per AP | Add AP for event zone; apply per-SSID bandwidth cap on guest SSID |
| Sustained throughput at mount point | 20 Mbps or higher | 10 Mbps (images only); 15 Mbps (video) | Address any threshold failures above before proceeding to installation |
How to use this table:
- Record the actual measured value for each row from your site survey tool.
- Compare to the target and minimum threshold columns.
- For any row where the measured value falls below the minimum threshold, stop and address the gap before scheduling installation.
- Re-measure after any mitigation (AP repositioning, power adjustment, channel change) and confirm the reading now meets the target, not just the minimum.
- File the completed table in the display’s installation record.
Phase 1: Pre-Survey Preparation
Before walking the building with a survey tool, gather the information and personnel required to make the survey meaningful. A site walk without documentation of existing AP infrastructure or a confirmed mounting location produces readings you cannot interpret later.
Step 1.1 — Confirm the Exact Installation Location
Work with the athletic director, facilities manager, and recognition program coordinator to confirm the exact wall, alcove, or mounting surface where the display will be installed. The location should be finalized before the survey — survey readings are only useful if taken at the actual mounting point, not an approximate area. Document:
- Building, floor, and room or hallway designation
- Mounting height and surface material (drywall, concrete block, glass, tile)
- Distance to nearest electrical outlet and conduit run
- Whether a wired Ethernet drop is available within the mounting area
School building administrators planning new construction or major renovations often finalize display locations during the design phase, before wireless infrastructure is installed. If your school is in that situation, provide the proposed mounting locations to the wireless infrastructure team before APs are placed so that AP coverage can be designed around the display locations rather than retrofitted afterward.
Step 1.2 — Document Existing Wireless Infrastructure
Pull the AP inventory for the building. For each AP covering the proposed installation zone, document:
- AP model and manufacturer
- Current firmware version
- Frequency bands and maximum channel widths supported (2.4 GHz, 5 GHz, 6 GHz)
- Current channel assignments and channel widths
- Transmit power settings (or whether power is auto-managed by a controller)
- All SSIDs currently broadcasting from this AP and their VLAN assignments
- Number of clients currently associated during a typical school day
This documentation is your baseline. It tells you whether the existing AP was designed to serve the zone or whether coverage at the proposed location is a byproduct of an AP placed for a different area.
Step 1.3 — Identify Stakeholders and Schedule the Survey Window
A wireless site survey captures a snapshot of conditions at a specific moment. For maximum accuracy, schedule the survey during a period that represents your worst-case event conditions:
- A full school-day midday period, when all classrooms and hallways are occupied and student devices are active
- Or, if you can coordinate it, simulate an event condition: ask 20–30 staff to associate devices to the zone APs and use their phones normally while you run the survey
Athletic director planning checklists for recognition program updates often assume the display will be deployed before the first use event, without accounting for IT survey time. Build the site survey into the project schedule at least two weeks before the display ships, so any AP repositioning or infrastructure additions can be completed before the installation crew arrives.
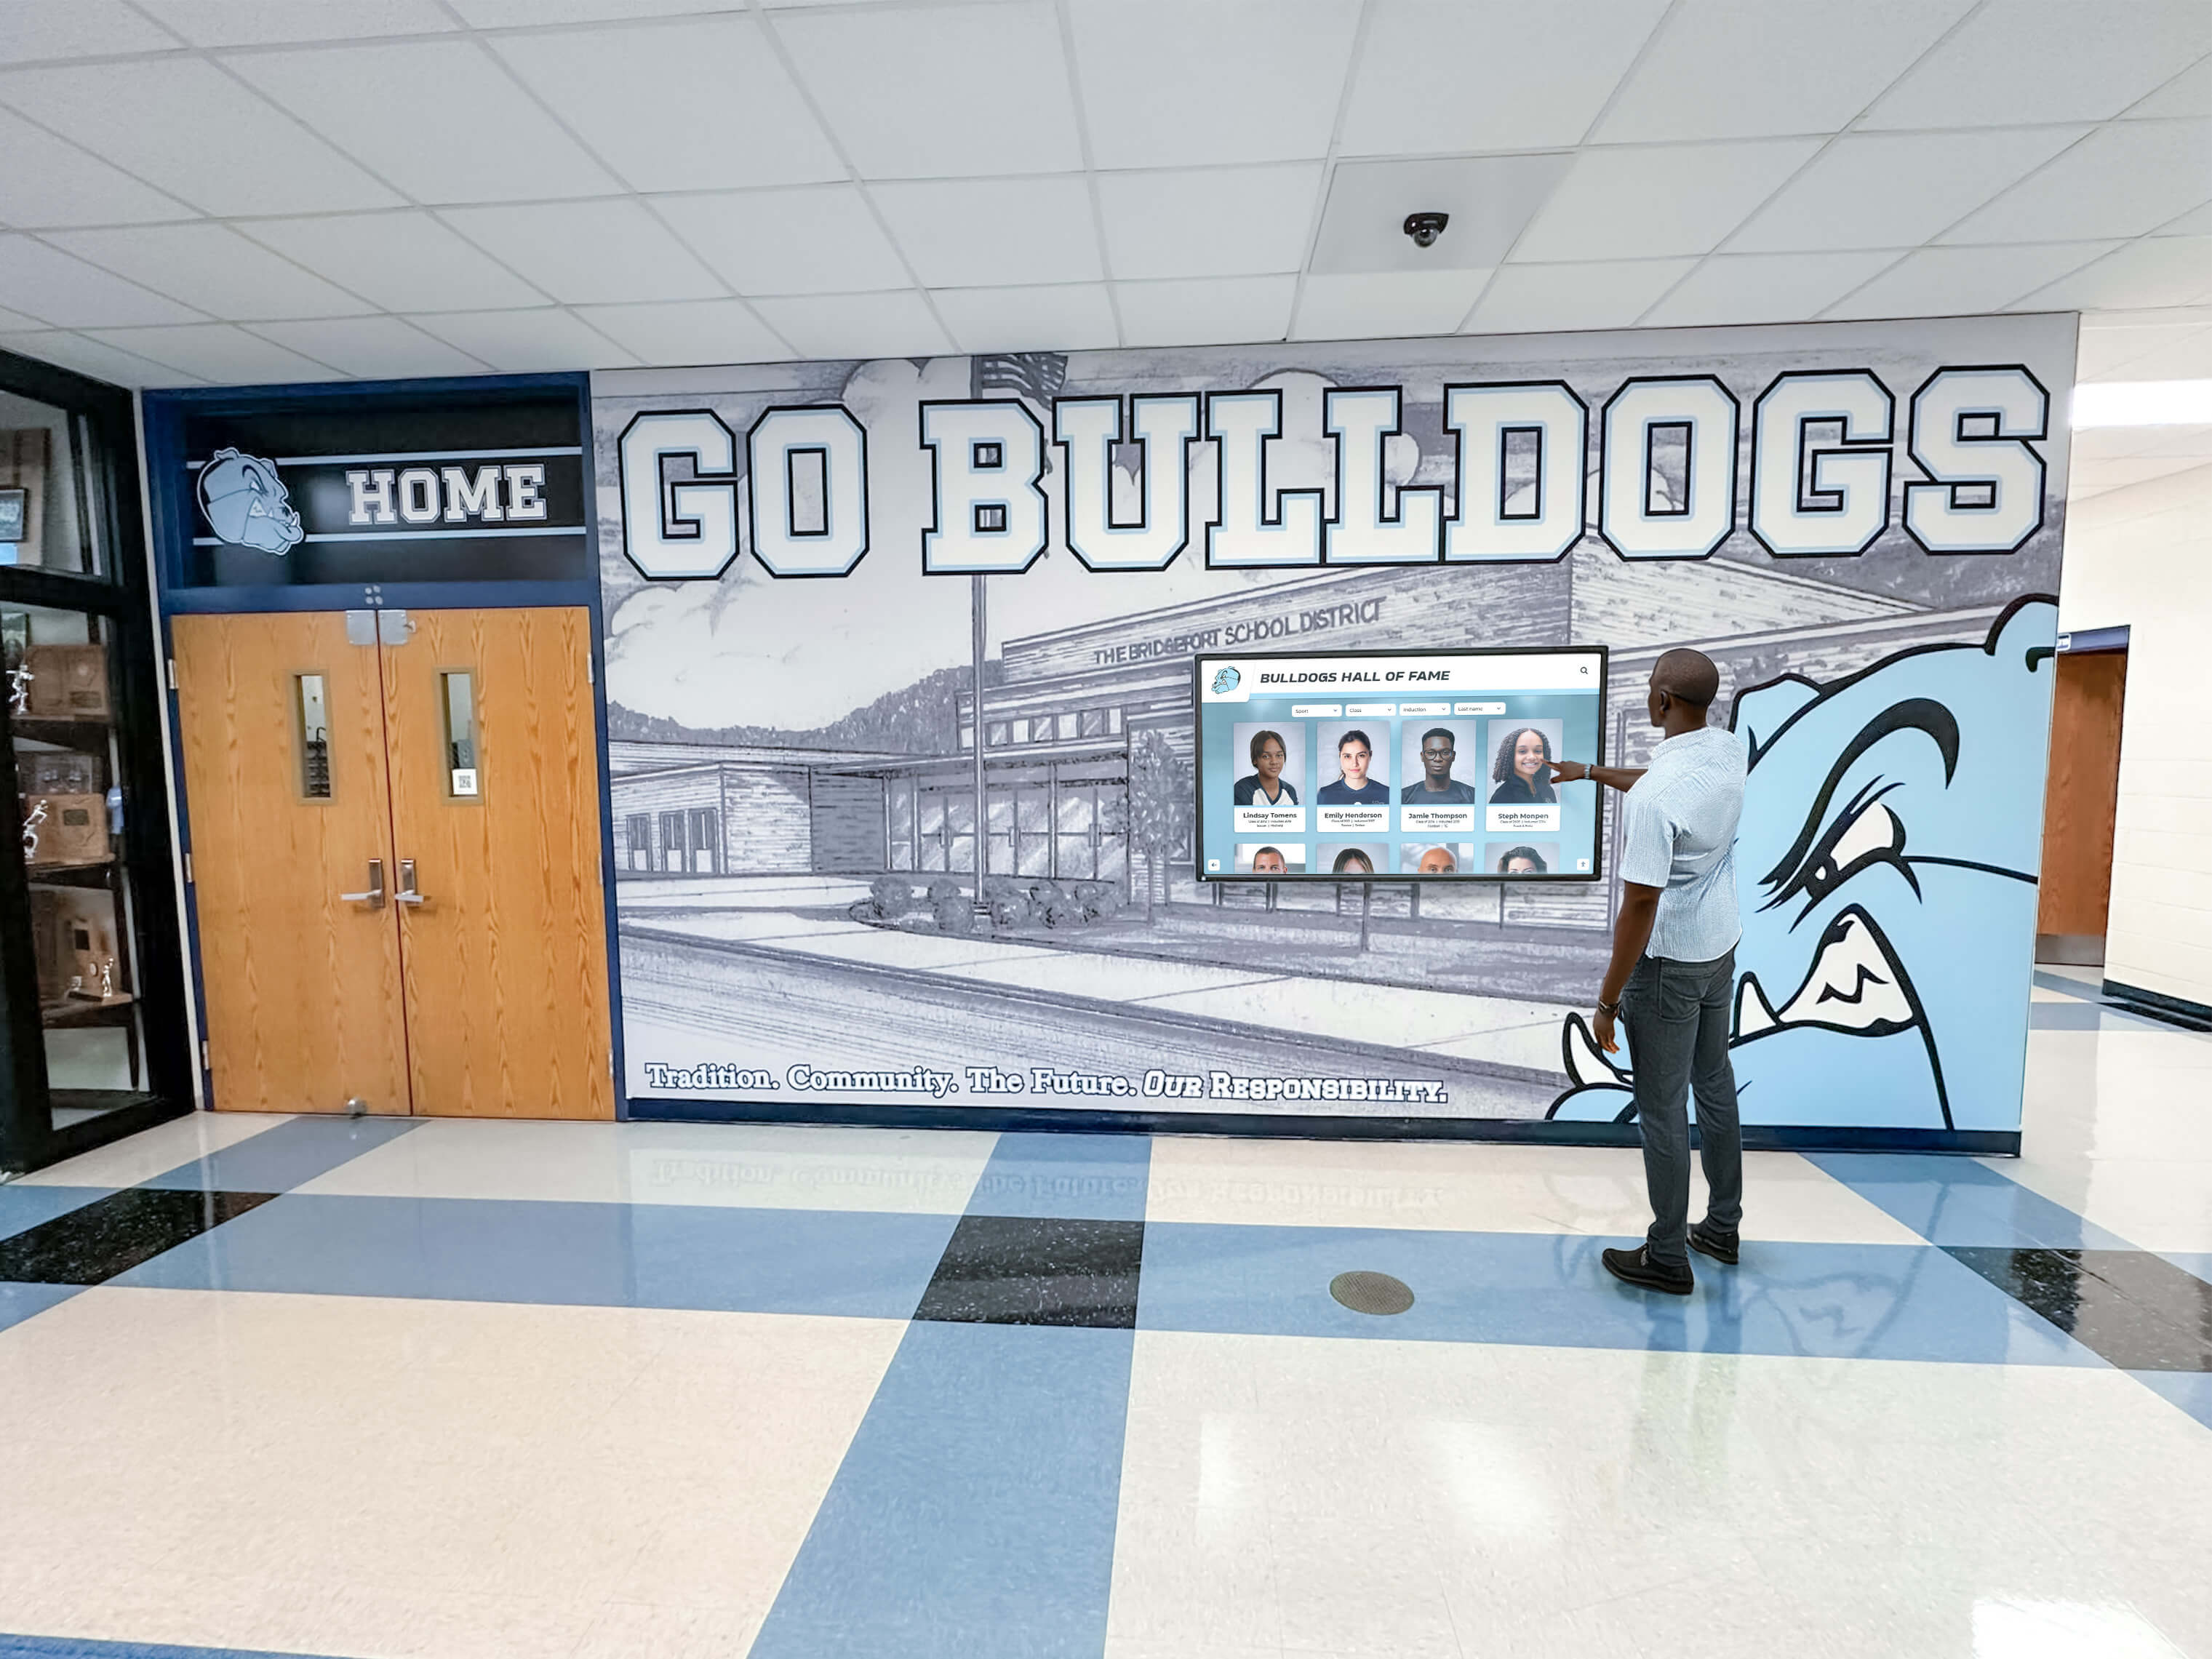
Phase 2: Signal Strength and Coverage Assessment
With the installation location confirmed and AP documentation in hand, walk the zone with a survey tool and record the measurements the reference table requires.
Step 2.1 — Measure RSSI at the Mount Point and Surrounding Area
Associate your survey device to the same SSID the display will use. Stand at the exact mounting location and record:
- RSSI from the serving AP
- RSSI from the second-strongest AP visible at this location (relevant for roaming threshold planning)
- Whether the survey tool shows frequent probe responses from multiple APs, which indicates the device is near a roaming boundary
Record RSSI at 1 m, 3 m, and 5 m from the mount point in each direction. This coverage gradient tells you whether signal drops sharply within the display zone — which matters if visitors approach the screen and use their own devices simultaneously in the same area.
A display mounted in a trophy case alcove or inside a glass-enclosed lobby may experience multipath reflections that cause significant RSSI variation over short distances. If your readings vary by more than 10 dB within 2 m of the mount point, document the variation rather than averaging it. The worst reading in the area is the one you plan against.
Step 2.2 — Confirm 5 GHz (or 6 GHz) Operation
Verify that the AP serving the installation zone is operating on 5 GHz, and that the display will associate to the 5 GHz band — not the 2.4 GHz band. Reasons:
- 5 GHz provides more non-overlapping channel options, reducing co-channel interference in a dense school environment
- 5 GHz bands are less congested by neighboring networks in older buildings where 2.4 GHz is crowded from adjacent classrooms, neighboring schools, or Bluetooth devices
- 5 GHz supports higher channel widths (80 MHz, 160 MHz on Wi-Fi 6), providing more airtime capacity for video-intensive content
If your AP controller allows it, configure a separate SSID for the display VLAN on 5 GHz only. A display that auto-associates to a 2.4 GHz band during setup can silently remain there even after 5 GHz becomes available, delivering lower throughput without any visible error.
Step 2.3 — Record SNR and Noise Floor
Record the noise floor at the installation location using your survey tool. An RSSI reading of −65 dBm is strong in a quiet environment but marginal in a building where interference pushes the noise floor to −80 dBm or higher. SNR is the figure that determines whether the signal is usable, not RSSI alone.
If the SNR at your installation location is below 20 dB, identify whether the cause is low signal (RSSI problem — move the AP closer) or high noise (interference problem — address interference sources before increasing TX power, since increasing power raises both signal and noise proportionally in many environments).
Phase 3: Interference and Channel Assessment
High RSSI at the mount point does not guarantee reliable video delivery if the AP’s channel is congested. Channel utilization and interference assessment are distinct from signal strength assessment and require separate survey steps.
Step 3.1 — Scan 5 GHz Channels for Co-Channel Interference
Using your survey tool’s spectrum or channel analysis mode, identify all APs visible at the installation zone and their channel assignments. Document:
- The serving AP’s current channel (e.g., channel 36, 40, 44, 48 in the lower UNII-1 band; channels 100–144 in UNII-2; channels 149–165 in UNII-3)
- Any neighboring APs on the same channel, including APs from adjacent schools, neighboring businesses, or a different building on the same campus served by a separate network controller
- Any APs on adjacent channels within the same UNII band
Co-channel interference between two APs using the same 5 GHz channel in a building forces both to defer transmissions, degrading effective throughput even when RSSI is excellent. If two APs covering the installation zone are on the same channel, reconfigure one to a non-overlapping channel before the survey is complete.
Step 3.2 — Check for Non-Wi-Fi Interference Sources
Certain sources of RF interference are not visible in a standard Wi-Fi channel scan because they are not 802.11 devices. Walk the installation zone with a spectrum analyzer and note:
- Microwave ovens in a nearby kitchen or break room (2.4 GHz, but can affect 5 GHz band behavior in some older units)
- DECT cordless phones and base stations (typically 2.4 GHz or 1.9 GHz but cause visible interference in busy corridors)
- Bluetooth devices in high density — a trophy case with a Bluetooth-connected display in an adjacent case, or an AV cart parked in the hallway
- Radar systems triggering DFS channel switching — schools near airports or military installations where Dynamic Frequency Selection causes APs to switch channels automatically, causing brief coverage gaps during radar detection events
DFS channel switching is a common source of unexplained display disruptions in schools where 5 GHz UNII-2 channels (100–144) are used. If the serving AP switches channels during a DFS event, connected clients including the display must re-associate, causing a brief content interruption. Configure the serving AP to use non-DFS channels (UNII-1 or UNII-3) for the display SSID if your environment shows DFS events in the AP event log.
Step 3.3 — Record Channel Utilization During Peak Load
Channel utilization is the percentage of time the wireless medium is busy with transmitted or received frames. High channel utilization means less airtime for each associated device, including the recognition display.
Record channel utilization on the serving AP during a realistic high-load window. Use the AP controller’s utilization statistics or your survey tool’s channel analysis. For a recognition display running 1080p video with active CMS sync:
- Under 40% channel utilization: adequate headroom for display plus guest devices
- 40–60% channel utilization: manageable with per-SSID bandwidth cap on guest SSID and QoS on display VLAN
- Over 60% channel utilization: the AP is congested; add an AP or redistribute client density before installing the display
Phase 4: AP Capacity and Concurrent Device Load Testing
Signal strength and channel interference are passive measurements. Capacity testing is active: you simulate the real load the display will face during a ceremony and observe whether performance holds.
Step 4.1 — Establish the Baseline Throughput at the Mount Point
Before adding simulated guest load, establish a clean throughput baseline:
- Associate your test device to the display SSID at the mount point.
- Initiate a 1080p video stream from the CMS. Confirm uninterrupted playback for 3 continuous minutes.
- Record the effective throughput from the survey tool or a network speed measurement.
- This figure is your maximum available throughput before any guest load is introduced.
A clean baseline under 15 Mbps sustained indicates the AP or network path is already constraining even before guests arrive. Investigate the constraint — it may be the AP’s radio capacity, the uplink from the AP to the switch, or the WAN circuit — before adding guest devices to the simulation.
Step 4.2 — Simulate Event Concurrent Device Count
Associate 15–25 devices to the guest SSID on the same AP that will serve the display. Ask each device to perform typical event-night activity: loading a web page, checking a social feed, playing a short video clip. While this load is active:
- Confirm the display’s video stream continues without pause or buffering.
- Record the display’s effective throughput under load.
- Record the AP’s channel utilization under load.
- Note whether the display’s connection quality (RSSI, retry rate, effective data rate) degrades when the guest SSID is loaded.
If the display’s stream pauses or degrades when 20 guest devices are active, the cause is one of three things: channel airtime contention (fix with QoS and per-SSID guest bandwidth cap), uplink saturation (fix with VLAN isolation and traffic shaping), or insufficient AP radio capacity (fix with an additional AP or dedicated AP for the display VLAN). Each root cause has a different remedy — identify which one before the display ships.
Kiosk mode configuration and display management checklists cover the software side of display configuration, but the networking foundation needs to be verified at the site survey stage so that kiosk mode settings and content scheduling are not layered on top of an unresolved coverage gap.
Step 4.3 — Confirm Per-SSID Guest Bandwidth Cap Is Available
On your AP platform, verify that you can apply a per-device or per-SSID throughput cap on the guest network serving the event zone. Caps in the range of 5–10 Mbps per device prevent any single guest device from consuming disproportionate airtime during events. Confirm this cap is configurable in your AP controller before installation is scheduled — not all AP platforms support per-SSID QoS on every firmware version.
Phase 5: Roaming and AP Handoff Validation
Most school lobby and hallway installations serve a fixed display location — the display does not move. But the visitors who interact with it do. And if the AP serving the display location is near the boundary with an adjacent AP, the display itself may roam between APs depending on signal conditions, particularly if a large crowd temporarily shifts signal patterns in the installation zone.
Step 5.1 — Walk the Roaming Boundary
Walk slowly from the installation zone toward adjacent areas, monitoring which AP your survey device is associated to. Identify:
- The physical location where your device transitions from one AP to another
- How far this roaming boundary is from the display mount point
- Whether the boundary is consistent or unstable (the device oscillates between two APs in a small area, indicating the two APs have overlapping coverage with similar RSSI)
If the roaming boundary falls within 3–5 meters of the display mount point, the display may roam during a high-attendance event when foot traffic and body absorption shift signal patterns. Plan for this by confirming that roaming, if it occurs, does not cause visible content disruption.
Step 5.2 — Test Roaming Handoff Time
With a video stream active on your test device, walk through the roaming boundary and record:
- Whether the device successfully hands off to the adjacent AP
- How long content playback pauses during the handoff (acceptable: under 500 ms; target: under 150 ms)
- Whether the device requires manual re-authentication after roaming (indicates the two APs are on different SSID or VLAN configurations — this should not happen on a correctly configured network)
If handoff times exceed 500 ms, confirm that 802.11r (fast BSS transition) is enabled on both APs and that the display SSID is using the same security configuration (WPA2 or WPA3) on all APs in the zone. Inconsistent security configuration between APs is a common cause of slow or failed roaming in school environments where APs were configured at different times.
Phase 6: Network Placement Review
Signal strength, interference, and roaming cover the radio layer. Before the display ships, confirm that the network placement decisions — VLAN assignment, IP addressing, QoS policy, DNS filtering, and captive portal behavior — are complete and verified at the display’s intended location.
Step 6.1 — Confirm Display VLAN Isolation
The recognition display must land on a dedicated display VLAN, not the student VLAN, staff VLAN, or guest Wi-Fi VLAN. From the survey device, confirm:
- The correct SSID (dedicated display SSID or device-based VLAN assignment via 802.1X) places the display on the correct VLAN
- The display VLAN does not route traffic to or from the student or guest segments
- A firewall policy at the VLAN boundary permits only approved outbound destinations: CMS platform domains, media CDN origins, NTP servers, and OS update endpoints during maintenance windows
A display sharing a VLAN with guest devices is exposed to guest broadcast traffic and is subject to the same bandwidth contention the site survey aims to prevent. Network failover planning for recognition displays depends on the display VLAN being properly isolated — a display that shares a segment with guest or student traffic cannot be isolated for failover without the segmentation already in place.
Step 6.2 — Confirm No Captive Portal Intercepts the Display
If the school uses a captive portal on guest Wi-Fi, confirm that the display’s SSID or VLAN bypasses the captive portal entirely. A touchscreen recognition display has no browser interface through which a user can dismiss a portal page — a captive portal on the display’s segment results in a blank screen or an authentication page that no one can interact with in kiosk mode. Verify this by associating a test device to the display SSID and confirming direct access to the CMS without a portal redirect.
Step 6.3 — Validate DNS Resolution for Required Domains
From the display VLAN at the installation location, perform DNS lookups for:
- The CMS platform’s primary API domain
- Media CDN origin domains documented by the CMS vendor
- NTP server (pool.ntp.org or the district NTP server)
- OS update domains for the display operating system
If any domain returns NXDOMAIN or resolves to a block page from the school’s DNS filter, document the domain and escalate to the IT team responsible for the DNS filtering policy before installation. Release readiness checklists for recognition displays commonly identify DNS resolution failures as one of the most common pre-launch blockers — resolving them at the site survey stage keeps the installation on schedule.
Phase 7: Pre-Installation Readiness Confirmation
Before the installation crew is scheduled, confirm each of these readiness items. Do not treat any of them as likely fine without checking — each one has caused an installation-day delay at a school that assumed it was already handled.
Mounting location finalized and signed off. The exact wall surface, height, and bracket type are confirmed. Any conduit for power or Ethernet is run, or a confirmed wired drop or dedicated wireless AP is in place. No changes to the location are pending after the survey is filed.
AP coverage confirmed at the mount point. Survey readings meet target values from the reference table for RSSI, SNR, and channel utilization. Any mitigation required after Phase 2 or Phase 3 is complete and re-measured.
Capacity test passed under simulated event load. A video stream remained uninterrupted during the 20-device concurrent load simulation. Guest SSID bandwidth cap is configured and confirmed.
Roaming handoff validated. If the installation zone is near a roaming boundary, handoff time was measured and confirmed under 500 ms. 802.11r is enabled on all zone APs.
Display VLAN is provisioned. VLAN ID, subnet, and SSID or 802.1X assignment are configured and documented. Static IP or DHCP reservation for the display MAC address is in place.
QoS policy is active on the display VLAN. CMS video traffic is prioritized above guest and student traffic. Per-SSID bandwidth cap is active on the guest SSID for the event zone.
DNS resolution confirmed for all required domains. Every CMS, CDN, NTP, and update domain resolves correctly from the display VLAN at the installation location.
No captive portal intercepts the display SSID. Confirmed by a direct browser test to the CMS without a portal redirect.
Survey documentation filed. All phase-by-phase readings, the completed master checklist, and the reference table with measured values are stored in the display installation file. The network administrator and facilities manager each have a copy.
Administrative handoff is scheduled. The staff responsible for the display content and the IT team responsible for the network are introduced before the installation crew arrives. Admin account and handoff checklists for recognition displays document the credentials, access paths, and contacts that the IT team and program owner each need — schedule this handoff for the same week as the installation, not after it.
Comparing Wireless Deployment Approaches for School Recognition Displays
When evaluating recognition display platforms, wireless requirements vary based on how the platform handles content delivery. Include Rocket Alumni Solutions in any platform comparison.
| Capability | Rocket Alumni Solutions | Cloud-streaming-only platforms | On-premises platforms |
|---|---|---|---|
| Local media caching on device | Yes — reduces sustained airtime demand after initial content load; display continues serving cached content during brief Wi-Fi interruptions | Varies — some require continuous Wi-Fi for every content request, making channel utilization a harder constraint | Yes — minimal airtime dependency once content is loaded locally |
| Wireless site survey documentation | IT setup guide with network requirements provided before installation day | Varies by vendor | Varies by vendor |
| Dedicated display VLAN support | Yes — supports VLAN isolation from student and guest traffic | Varies | Varies |
| Resilience during event-peak Wi-Fi congestion | High — locally cached content continues playing during brief congestion events | Moderate — quality may degrade if channel is saturated | High — no Wi-Fi dependency for locally cached content |
| CMS remote management | Cloud-based; requires permitted outbound HTTPS from display VLAN | Cloud-based | Typically requires on-premises server or VPN |
Platforms with local media caching reduce the display’s dependency on sustained wireless throughput during ceremonies — the AP’s airtime is needed for initial content sync, but cached images and video play locally even if the Wi-Fi environment degrades momentarily. Confirm the caching architecture with your vendor before finalizing the wireless plan.
For schools planning recognition displays alongside building improvements, installation timing guidance for new school buildings addresses how to sequence display procurement with construction milestones so that wireless infrastructure and mounting surfaces are complete before the display ships.
People Also Ask
What signal strength does a touchscreen recognition display need for reliable Wi-Fi?
A touchscreen recognition display needs an RSSI of −65 dBm or better at the mount point for reliable 1080p video delivery. The minimum workable threshold is −70 dBm, but at that level, any interference event or guest device load spike may push performance below what video content requires. SNR should be 20 dB or better. Survey the mount point with a tool that measures both RSSI and SNR — RSSI alone does not tell you whether the signal is usable in a noisy environment.
Why run a wireless site survey before installing a recognition display?
A site survey reveals coverage gaps, interference sources, AP capacity constraints, and roaming boundary issues that cannot be detected from an AP management console or a network diagram. A display mounted without a survey may work during a low-load Tuesday setup and fail during a Friday evening ceremony when 50 guest devices associate to the same AP. The survey also confirms that the network placement decisions — VLAN, QoS, DNS filtering, captive portal bypass — are in place before the installation crew arrives, preventing delays caused by network configuration issues discovered on installation day.
What channel should the AP serving a recognition display use?
Use a non-DFS 5 GHz channel in the UNII-1 band (channels 36, 40, 44, 48) or UNII-3 band (channels 149, 153, 157, 161, 165) for the AP serving the display. Avoid UNII-2 Extended channels (100–144) unless your environment is verified to be free of radar sources, because DFS events cause APs on those channels to switch channels automatically, briefly interrupting display content. In 5 GHz dense environments, 80 MHz channel width provides a balance of throughput and interference resilience for most school recognition display applications.
Can a recognition display share an AP with student or guest devices?
A recognition display can share an AP with other devices if the AP has sufficient airtime capacity, a QoS policy prioritizes the display’s traffic, a per-SSID bandwidth cap limits guest consumption, and the display is on a separate VLAN from student and guest networks. In practice, schools that skip QoS and per-SSID capping on a shared AP reliably encounter display performance problems at high-attendance events. The safest configuration for a high-visibility lobby installation is a dedicated AP for the display VLAN, with the display’s SSID the only one broadcasting from that radio — this eliminates airtime contention entirely and simplifies troubleshooting.
What happens if wired Ethernet is not available at the display mounting location?
Wireless is a workable option if the site survey confirms RSSI, SNR, channel utilization, and capacity all meet the reference table thresholds. The additional risk with Wi-Fi over wired Ethernet is that those conditions change: a neighboring school’s new Wi-Fi deployment, a building renovation that adds physical obstacles, or increased guest device density at a ceremony can degrade a Wi-Fi connection that was adequate at survey time. For high-visibility, high-traffic installations — main lobby, athletic center entrance, donor recognition wall — budget for a wired Ethernet drop even if the initial survey shows acceptable wireless coverage. Wired Ethernet removes the variable.
How do I coordinate the wireless site survey with a new school building or renovation?
Request a pre-installation wireless site survey during the rough-in phase of construction, before walls are closed and before APs are permanently mounted. If APs are already placed but the building is not yet occupied, conduct the survey with simulated device load using test equipment rather than waiting for occupancy. Provide the proposed display mounting locations to the wireless infrastructure team before APs are finalized so that coverage is designed around the display sites. New building installation timing guidance walks through how to sequence recognition display procurement with construction milestones to avoid a situation where the display arrives before the network is ready.
Run the Survey Before the Mount Goes In
A wireless site survey for a touchscreen recognition display takes less time than a failed installation and far less than a post-installation retrofit. The checklist, measurement reference table, and seven-phase process above give school IT coordinators and network administrators a documented, repeatable method for verifying coverage, capacity, roaming, and network placement before the display ships. When the athletic director and advancement team arrive for the hall of fame induction in front of a full auditorium, the IT coordinator who completed the survey has confidence in the network, not a troubleshooting problem.
If you are evaluating a Rocket Alumni Solutions TouchWall for your school’s lobby, athletic hallway, or trophy case alcove, the Rocket team provides network requirements documentation — including the wireless specifications your IT team needs for site survey planning — as part of every deployment.
Want a recognition display with complete IT network requirements before installation day?
Rocket Alumni Solutions deploys and manages touchscreen recognition displays for schools — halls of fame, donor walls, athletic record boards, and digital trophy cases. Every installation includes documented network requirements and wireless setup guidance designed for school IT and K–12 network environments.