Intent: Define practical requirements for implementing effective university alumni wall systems
Alumni relations directors and advancement teams face mounting pressure to demonstrate ROI while strengthening engagement across geographically dispersed graduate populations. Traditional plaques and static photo walls fail to capture the dynamic stories that inspire giving and build lasting connections. A university alumni wall should function as operational infrastructure—not decorative artwork—that measurably increases engagement metrics, facilitates mentorship connections, and drives advancement outcomes.
This guide provides concrete implementation requirements, technical specifications, and budget planning tools for universities evaluating alumni wall systems. Rather than abstract concepts, you’ll receive actionable checklists, wiring diagrams, ADA compliance templates, and ROI calculations refined from hundreds of institutional deployments. Whether you’re retrofitting existing recognition displays or planning new construction, these frameworks ensure your investment delivers quantifiable value for decades.
Universities investing $15K-$45K in alumni recognition infrastructure need more than inspiration—they need specifications. This guide translates strategic goals into measurable technical requirements, helping you document exactly what your campus needs before engaging vendors or allocating capital improvement budgets.
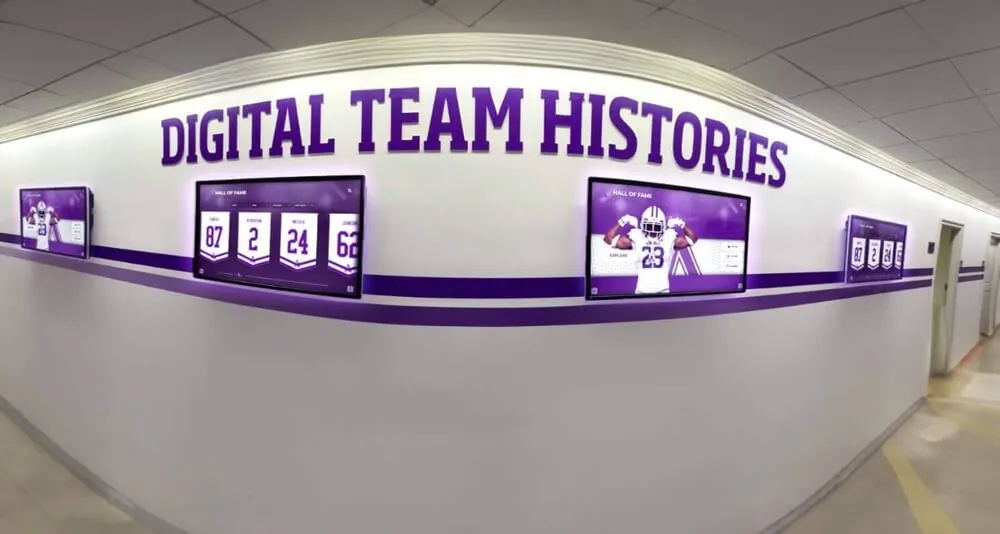
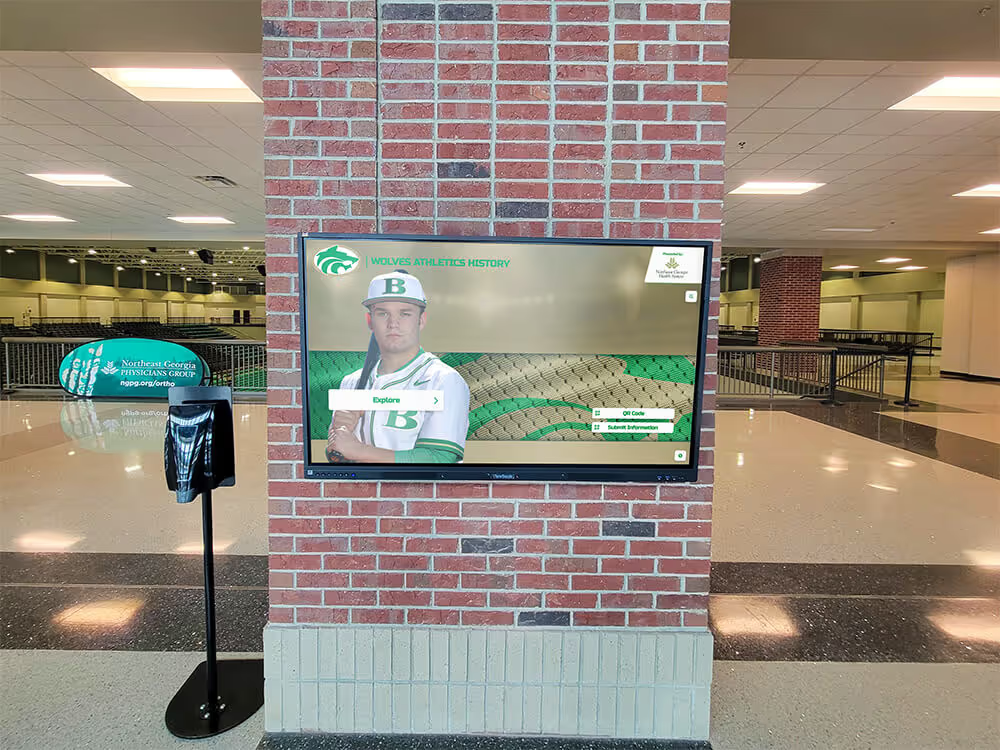
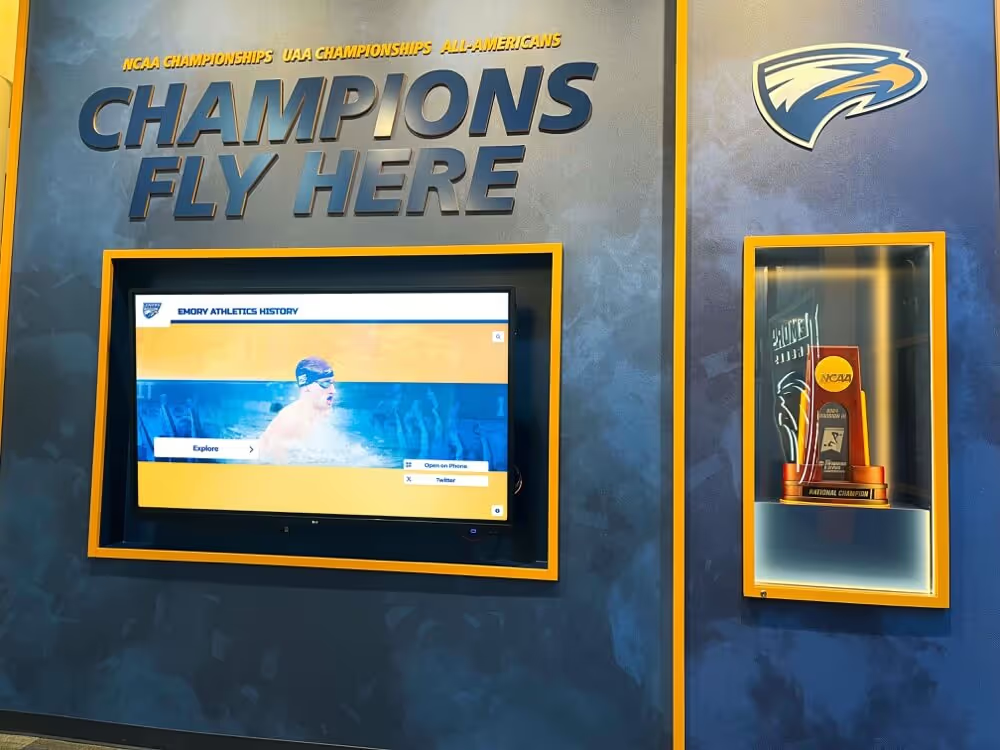
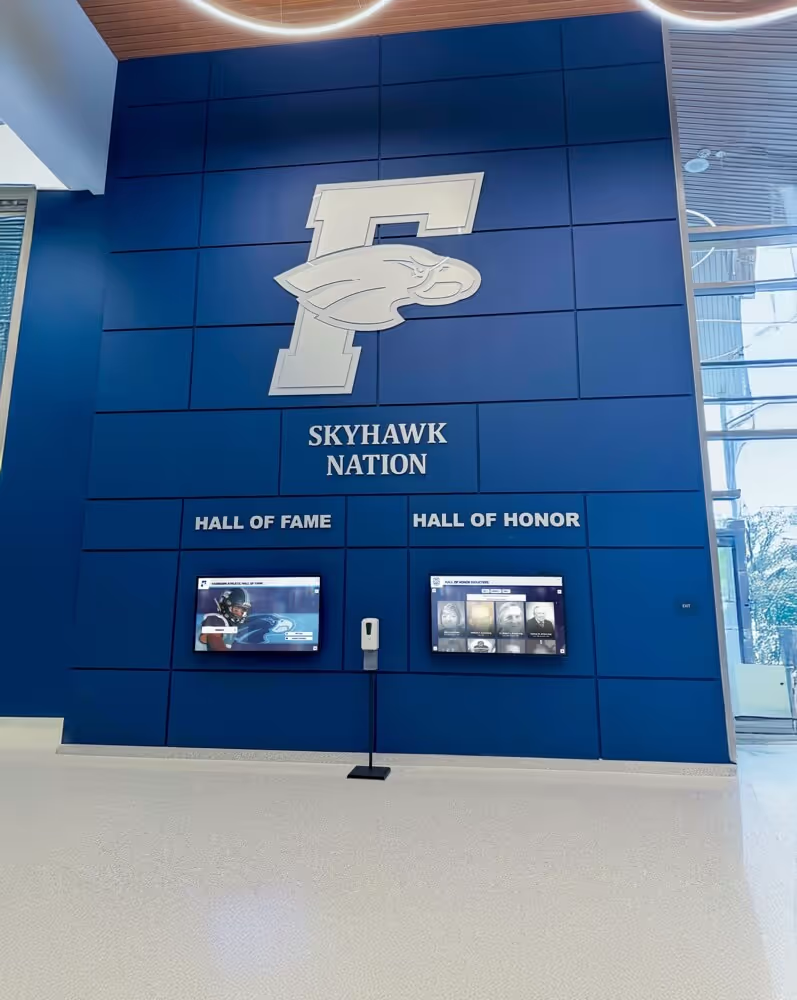
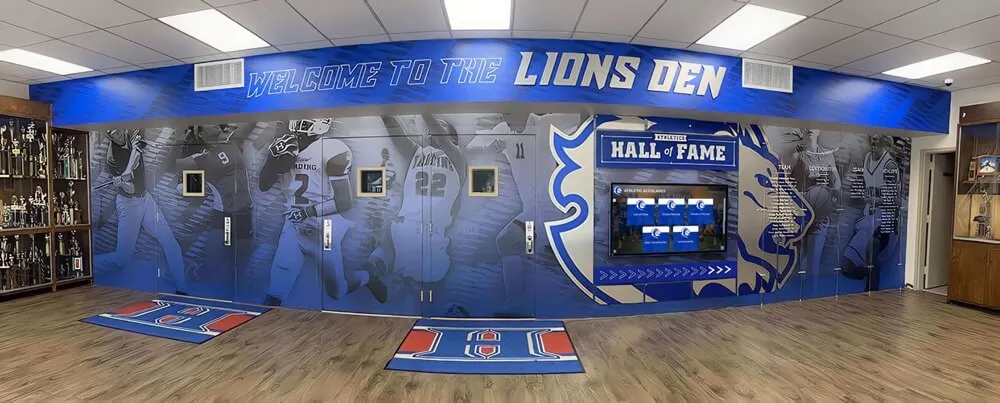
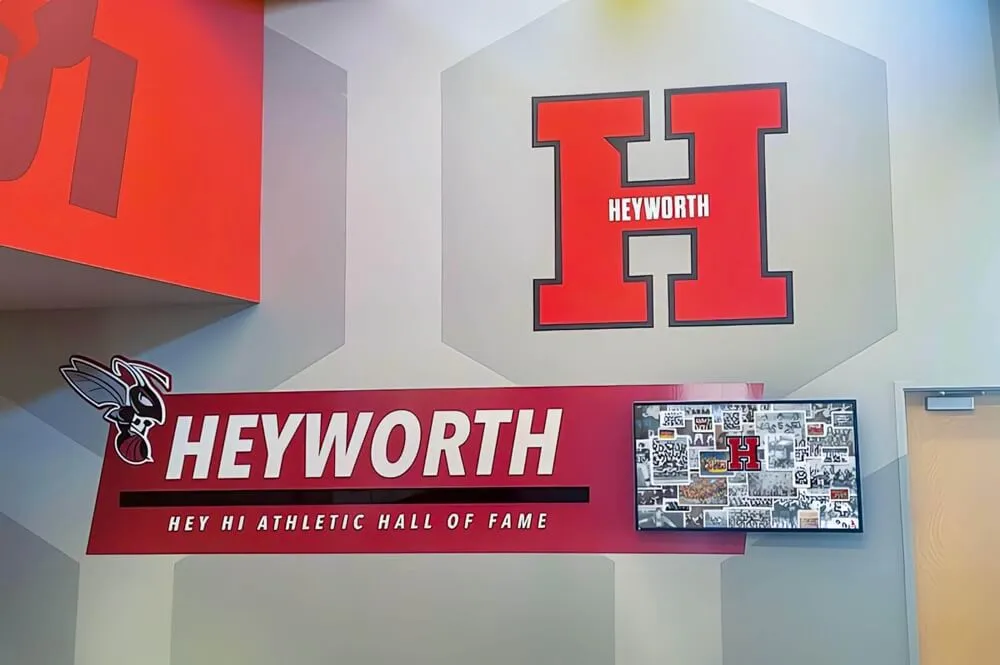
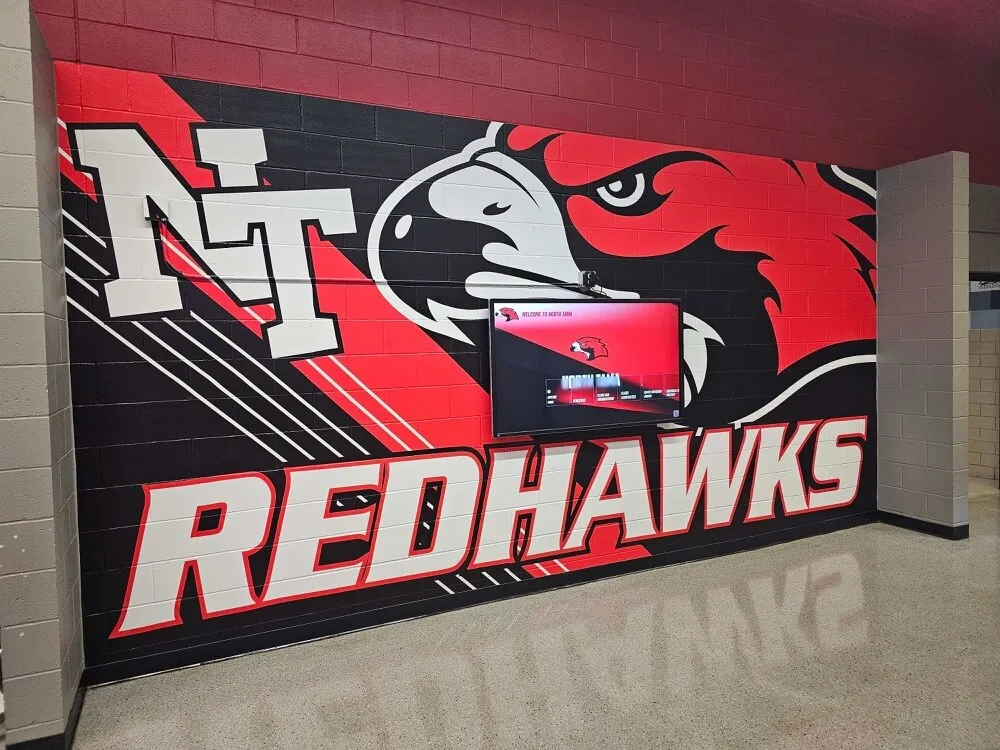
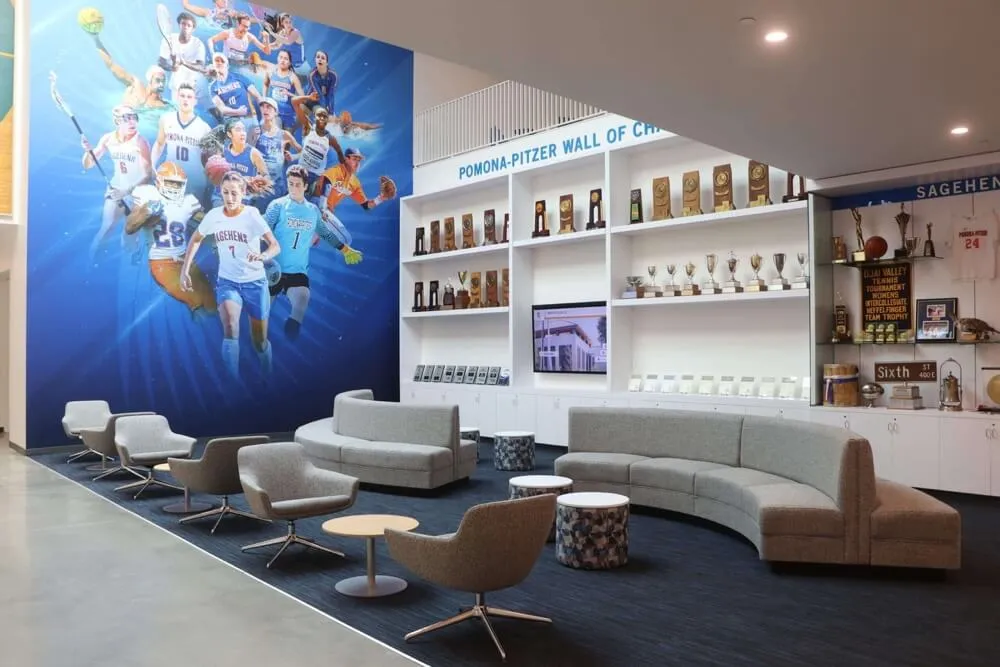
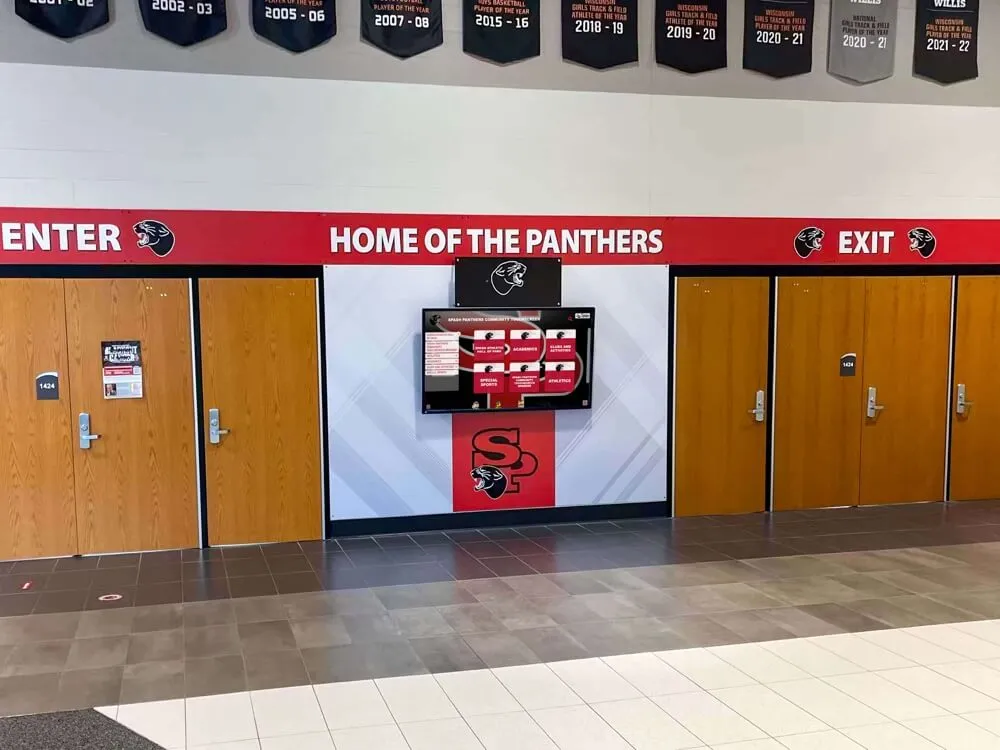
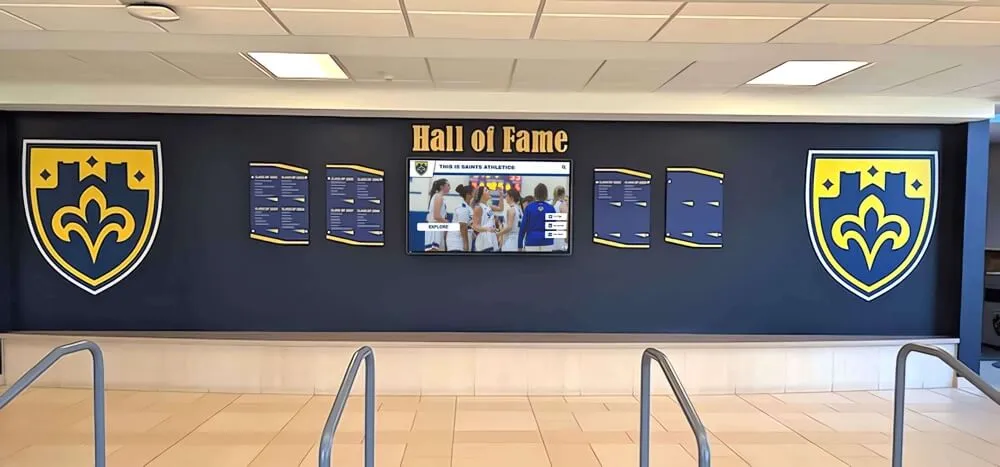
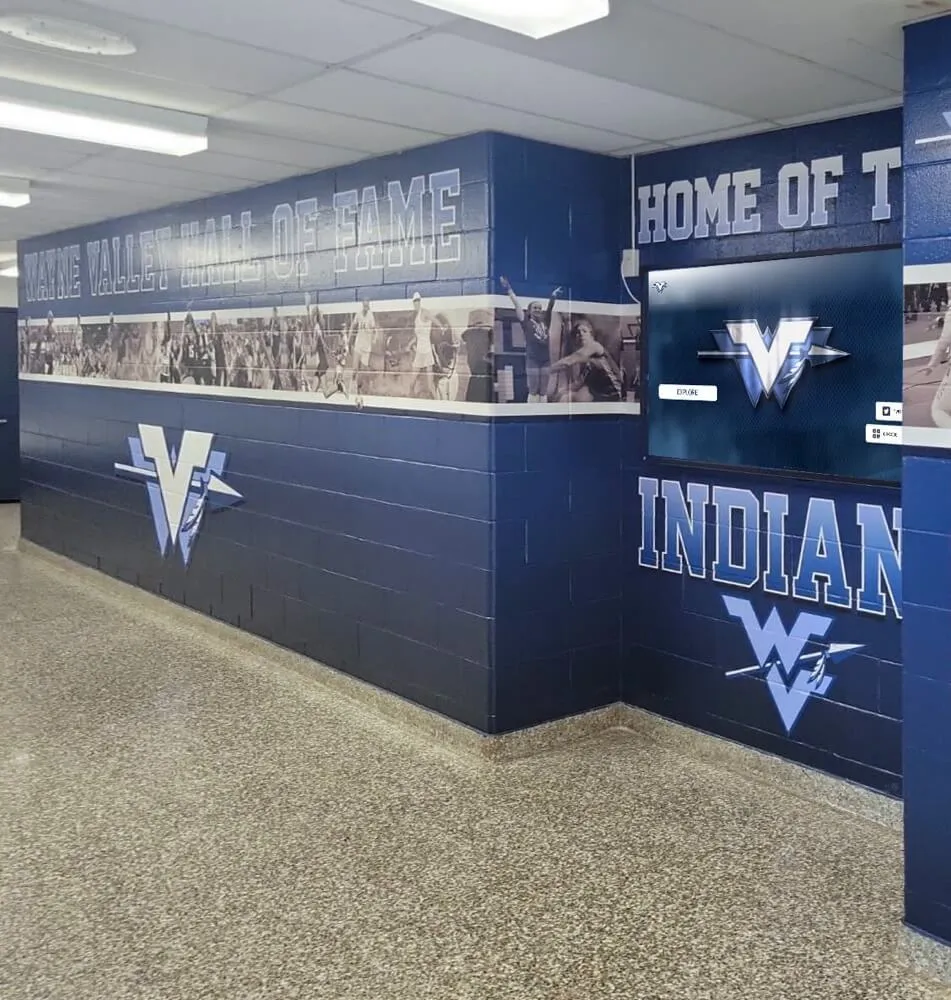
Contemporary university alumni walls combine professional installation with interactive technology that scales to accommodate growing recognition needs
Before You Start: Prerequisites and Discovery Phase
Successful alumni wall projects begin with systematic documentation of institutional requirements, existing constraints, and success metrics. Skip these discovery steps, and you’ll face costly change orders or underutilized systems that fail to meet stakeholder expectations.
Stakeholder Alignment Requirements
Document Decision Authority:
- Identify who controls capital improvement budgets for your target installation location
- Map approval workflows for technology purchases exceeding $10K
- Determine if IT infrastructure changes require separate review processes
- Confirm advancement leadership supports measurable engagement targets
Define Success Metrics Before Launch:
- Alumni database update rate improvements (target: 15-25% increase within 12 months)
- Event attendance lift for reunions and homecoming (benchmark against 3-year averages)
- Giving participation rate changes among recognized vs. unrecognized alumni cohorts
- Physical display interaction frequency (set minimum threshold: 200 monthly unique sessions)
- Web platform traffic from alumni IP addresses (separate from campus network visits)
Establish Content Governance Model:
- Assign dedicated content manager with 4-6 hours weekly capacity
- Create editorial calendar for quarterly profile additions and updates
- Define approval workflows: draft → review → publish stages with clear ownership
- Set minimum content standards (word counts, image resolution specs, required fields)
Physical Site Assessment Checklist
Complete this assessment at your proposed installation location. Measurements directly impact equipment specifications and installation costs.
Wall and Space Measurements:
- Available wall width: ___ feet (measure clear space between architectural elements)
- Wall height from floor to obstruction (ceiling, molding, fire suppression): ___ feet
- Viewing distance: ___ feet (measure from opposite wall or primary foot traffic path)
- Ceiling height: ___ feet (affects mounting height calculations for ADA compliance)
- Floor type: ☐ Concrete ☐ Tile ☐ Carpet ☐ Other: ___
- Wall construction: ☐ Concrete/CMU ☐ Drywall with studs ☐ Brick ☐ Glass ☐ Other: ___
Environmental Conditions:
- Natural light exposure: ☐ Direct sunlight ☐ Indirect daylight ☐ Interior/artificial only
- Peak foot traffic times: ☐ 7-9am ☐ 11am-1pm ☐ 3-5pm ☐ Evening events
- Climate control: ☐ HVAC controlled year-round ☐ Seasonal variation ☐ Unconditioned space
- Ambient noise level: ☐ Quiet (library-like) ☐ Moderate (conversation) ☐ High (arena/cafeteria)
Technical Infrastructure:
- Nearest power outlet: ___ feet from proposed display location
- Outlet type: ☐ 110V standard ☐ 220V ☐ Dedicated circuit available ☐ Unknown
- Network connectivity: ☐ Ethernet jack within 50’ ☐ WiFi available (signal strength: ___) ☐ None
- Network bandwidth: ☐ Gigabit ☐ 100Mbps ☐ <100Mbps ☐ Unknown
- IT approval required for network drops: ☐ Yes ☐ No ☐ Unknown
- Firewall/content filtering that may block cloud services: ☐ Yes ☐ No ☐ Unknown
Accessibility Considerations:
- Wheelchair-accessible approach to display: ☐ Yes ☐ No—describe barriers: ___
- Minimum clear floor space in front of display: ___ feet × ___ feet
- Other accessible routes to same content: ☐ Web platform ☐ Mobile app ☐ Printed materials
- Campus ADA coordinator consulted: ☐ Yes ☐ No—name: ___
Photographic Documentation: Take photos from multiple angles—straight-on from 10 feet, left/right oblique views showing adjacent spaces, close-ups of wall surfaces and nearby outlets. These images help vendors prepare accurate installation bids without scheduling site visits.
Technical Requirements Calculator
Use these inputs to generate vendor specification sheets that ensure competitive bids address identical requirements.
Display Size Calculation:
- Viewing distance × 0.12 = minimum screen diagonal (inches)
- Example: 15-foot viewing distance × 0.12 = 21.6 inches → specify 43" minimum
- For high-traffic areas where multiple viewers gather, add 20-30% to calculated size
Resolution Requirements:
- Displays under 50": 1920×1080 (Full HD) minimum
- Displays 50-64": 3840×2160 (4K) minimum
- Displays 65"+: 3840×2160 (4K) required
- Text-heavy interfaces require 4K at any size for crisp readability at close range
Touch Technology Specification:
- Capacitive touch required (resistive or infrared create poor user experience)
- 10+ simultaneous touch points for multi-user interaction
- Response time <10ms (test with high-speed video if vendor claims appear inflated)
- Tempered glass protection rated for public spaces (minimum 4mm thickness)
Connectivity Requirements:
- Minimum: 10Mbps sustained download, 2Mbps upload
- Recommended: 50Mbps symmetric (especially for video content)
- Latency: <50ms to content delivery network edge servers
- Network address translation (NAT) traversal for remote management—confirm with IT
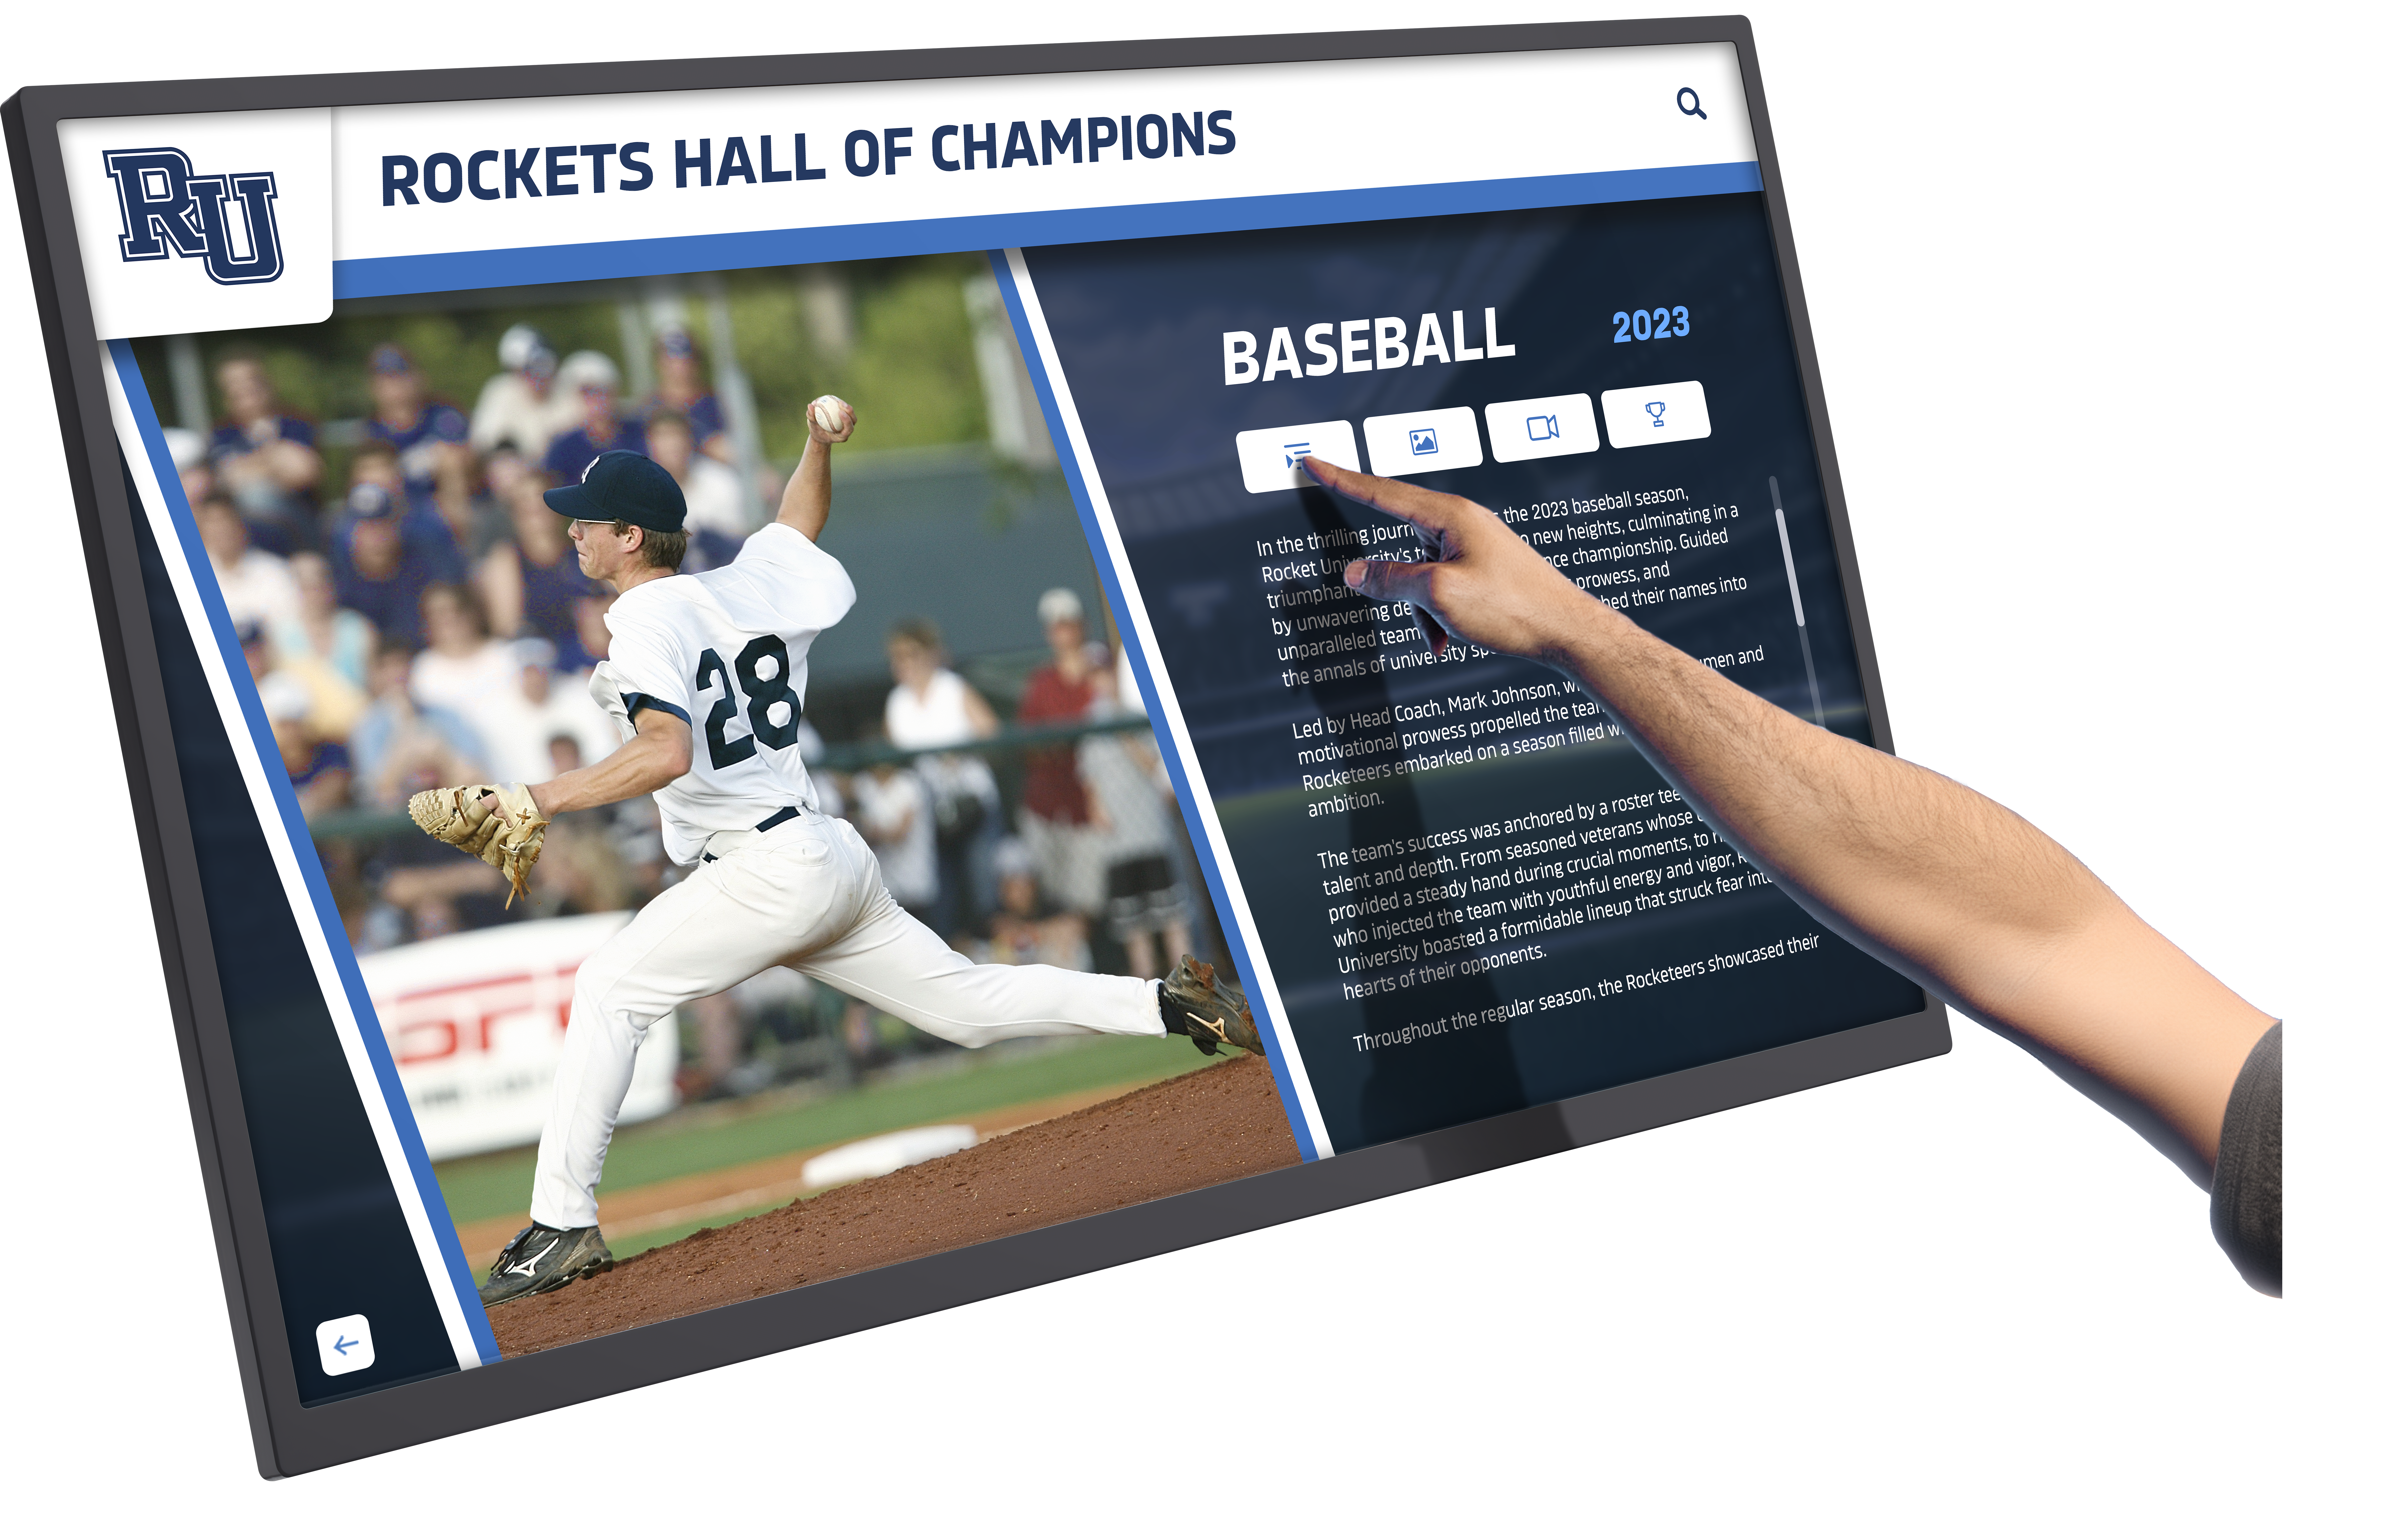
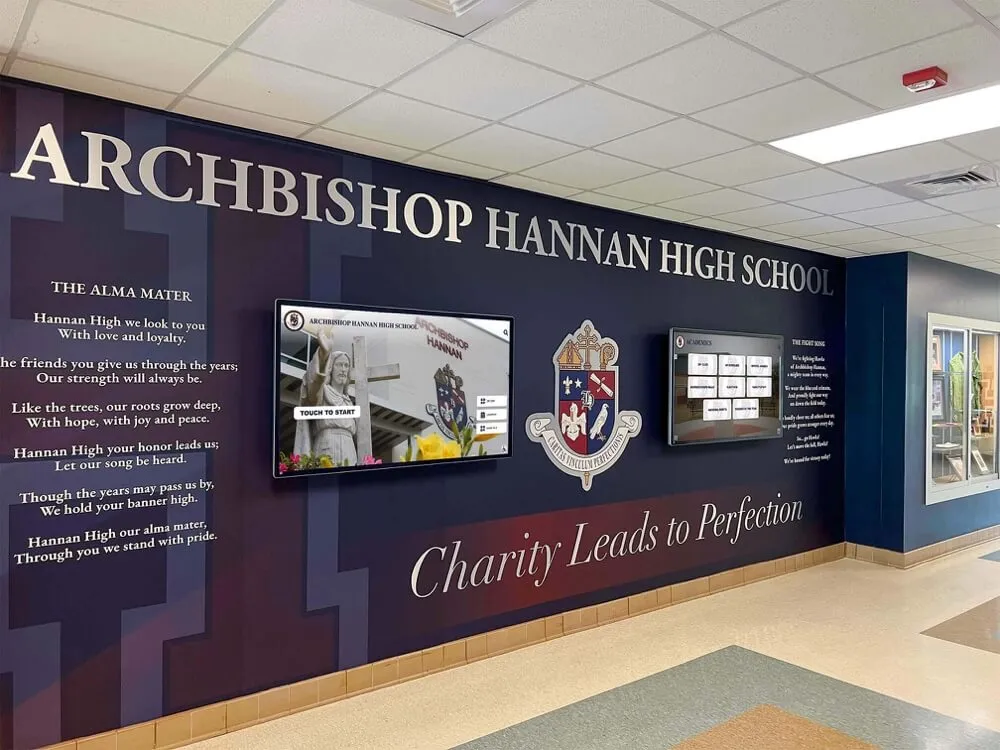
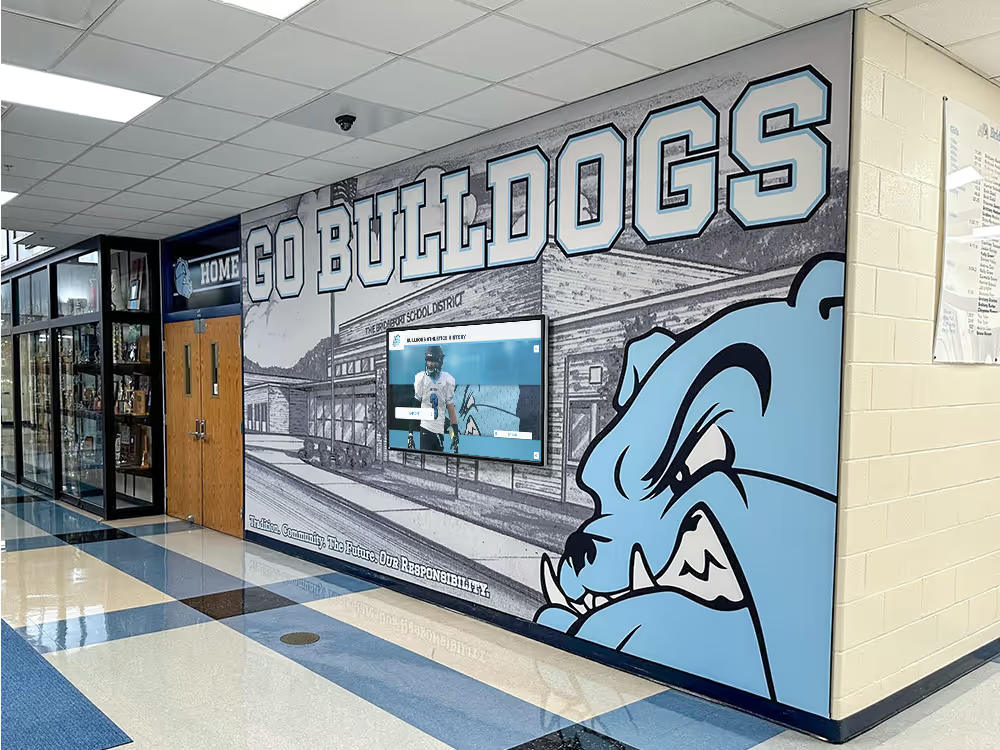
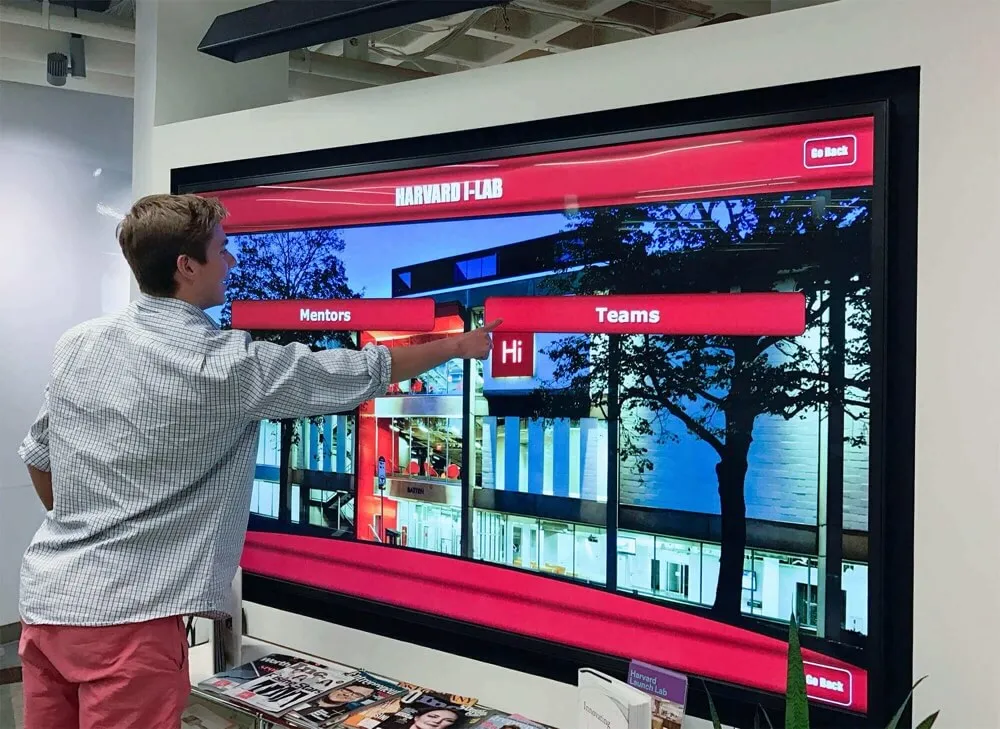
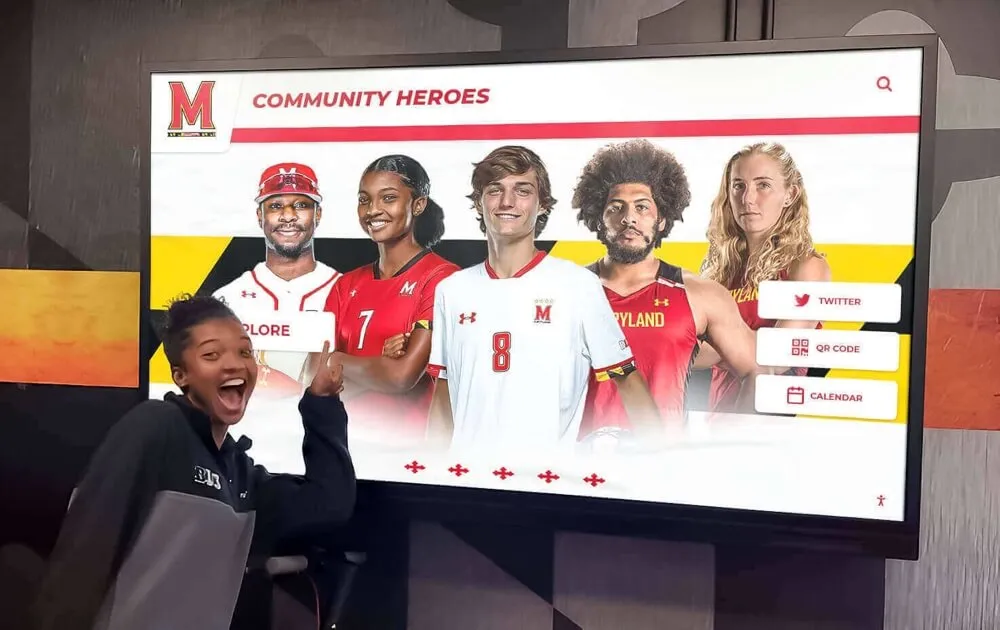
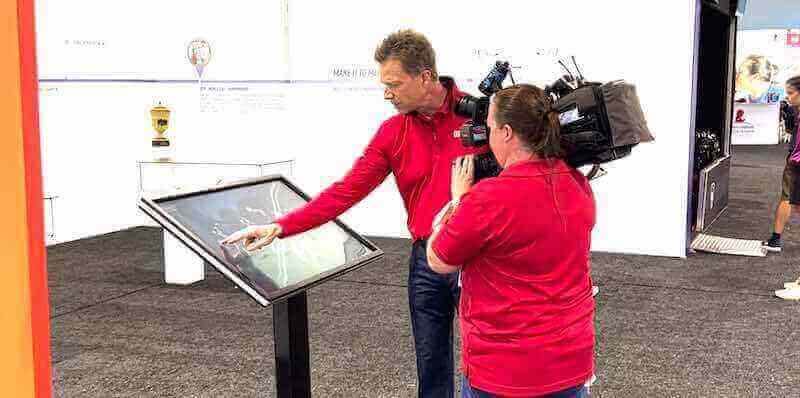
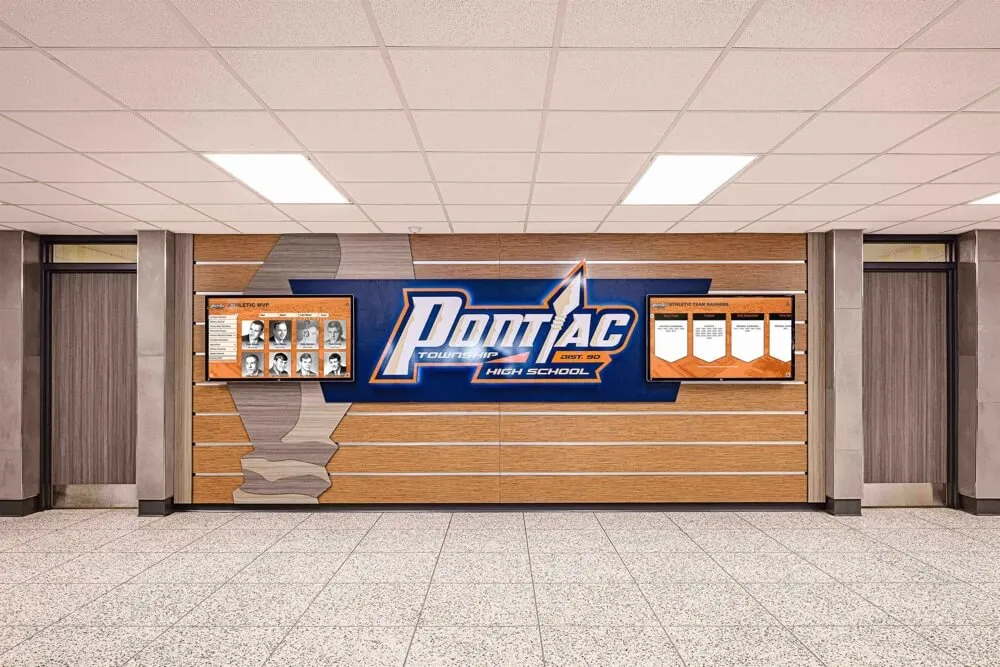
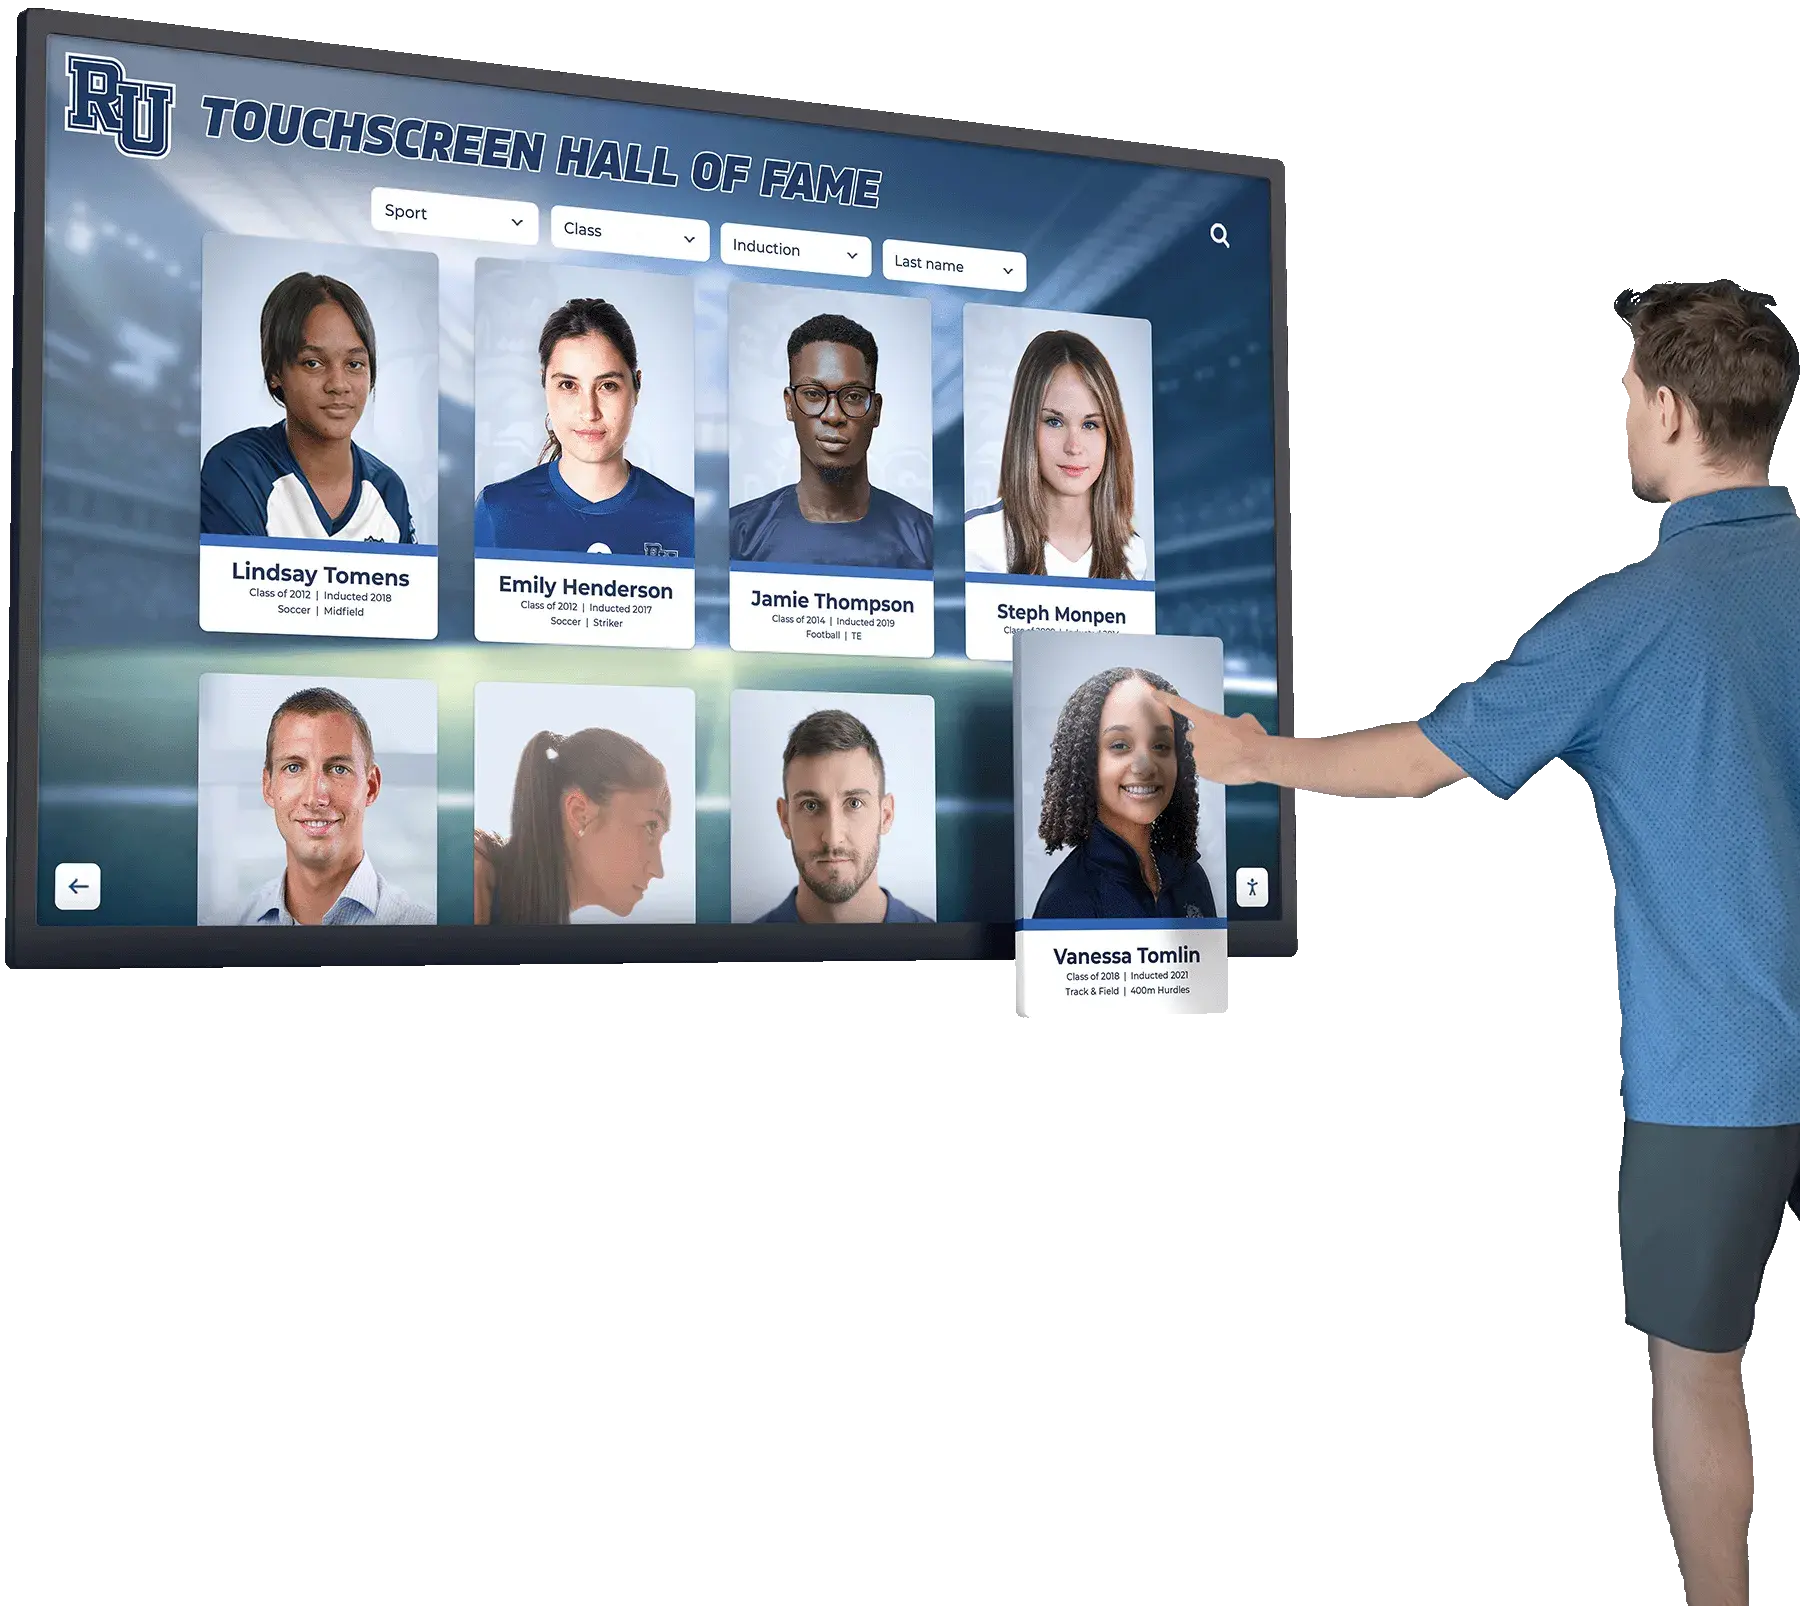
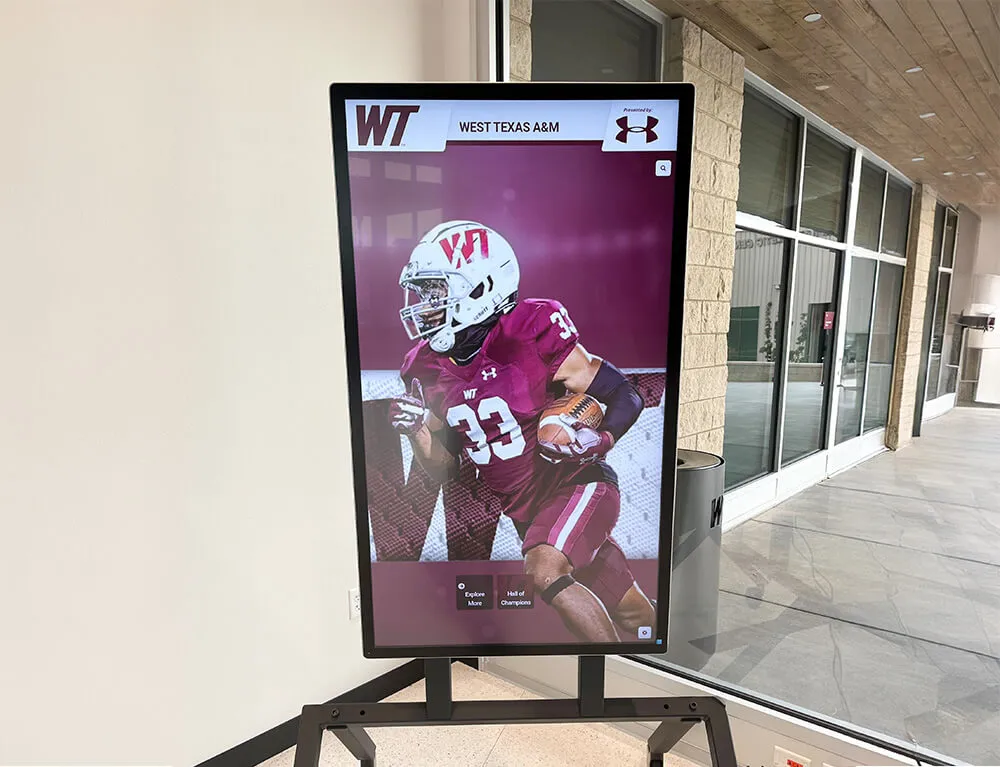
Capacitive touch technology provides smartphone-like responsiveness that users expect from interactive alumni displays
University Alumni Wall Concepts: Requirements by Implementation Model
Different institutions require different approaches based on recognition scale, budget parameters, and physical constraints. Each model below includes complete specifications.
Model 1: Single-Location Interactive Touchscreen (Budget: $15,000-$25,000)
Optimal Use Cases:
- Universities with 10K-30K living alumni
- Single high-traffic location (student union, alumni center lobby, athletics facility entrance)
- 50-200 detailed profiles initially, expanding 20-40 annually
- Content management by advancement staff without dedicated IT support
Hardware Specifications:
- 55" commercial-grade touchscreen display (alternatives: 49", 65" based on site assessment)
- Resolution: 3840×2160 (4K) minimum
- Brightness: 350-500 cd/m² (nits) for indoor installation with ambient lighting
- Viewing angle: 178° horizontal/vertical (IPS or equivalent panel technology)
- Operating hours rating: 16/7 minimum (24/7 rated preferred for longevity)
- Touch technology: Projected capacitive (PCAP) with tempered glass overlay
- Mounting: VESA-compatible wall mount or freestanding kiosk enclosure
Software/Platform Requirements:
- Cloud-based content management system (CMS) accessible via web browser
- No-code profile creation with template-based layouts
- Bulk import via CSV for historical data migration (map fields: name, grad year, degree, bio, photo URL)
- Search functionality: full-text name search with fuzzy matching (handles misspellings)
- Filtering: by graduation decade, degree/school, achievement category, geographic location
- Media support: JPEG/PNG images (auto-optimization), MP4 video (H.264/H.265 codec)
- Accessibility: WCAG 2.1 AA compliant interface (test with WAVE or axe DevTools)
Installation Requirements:
- Wall-mounted installation: locate studs for secure mounting, surface-mount conduit for power/data if no in-wall access
- Freestanding kiosk: minimum 48"×48" clear floor space per ADA guidelines, bolt base plate to concrete or use weighted base for stability
- Power: dedicated 15A circuit preferred (shared circuits cause reboots during load fluctuations)
- Network: CAT6 ethernet cable preferred over WiFi for reliability (document MAC address for IT asset tracking)
First-Year Operating Costs:
- Software subscription: $2,400-$4,800 annually (varies by features and institutional size)
- Content updates: 40-80 hours staff time at fully-loaded cost
- Electricity: ~$45 annually (55W display × 16 hours × 365 days × $0.12/kWh)
- Maintenance: $200-500 annually (cleaning supplies, minor hardware servicing)
Model 2: Multi-Display Network (Budget: $35,000-$65,000)
Optimal Use Cases:
- Universities with 30K+ living alumni
- Multiple recognition categories requiring thematic displays (athletics, academics, service, professional achievement)
- 3-5 installation locations across campus
- Coordinated content strategy with rotating features
System Architecture:
- 3-5 networked displays (43"-75" based on location-specific site assessments)
- Centralized content management: update once, publish to selected displays automatically
- Display-specific playlists: rotate alumni profiles based on proximity context (athletics honorees in rec center, academic achievers in library)
- Synchronized campaigns: feature same alumni cohort across all displays during reunion weekends
Advanced Features to Specify:
- Scheduled content: automatically surface homecoming-related profiles in October, giving campaign honors during annual fund drives
- Usage analytics dashboard: track which profiles receive most views, identify search patterns for content strategy
- QR code generation: automatically create unique QR codes linking physical signage to digital profiles
- Social media integration: embed live feeds from alumni association Twitter/Instagram accounts
Network Infrastructure Planning:
- Managed switch recommendation: if displays share network segment, specify managed switch with VLAN capability (isolate digital signage traffic from academic network)
- Bandwidth allocation: 10Mbps minimum per display (avoid network congestion during high-traffic periods)
- Remote management: document firewall rules required for vendor remote support (typically HTTPS/443 outbound only)
Maintenance Planning:
- Train 2-3 administrators: avoid single points of failure (document login credentials in password manager)
- Quarterly content audits: verify profile accuracy, update achievement milestones, refresh photos showing outdated fashion/hairstyles
- Annual hardware inspection: check mounting security, clean ventilation openings, update firmware
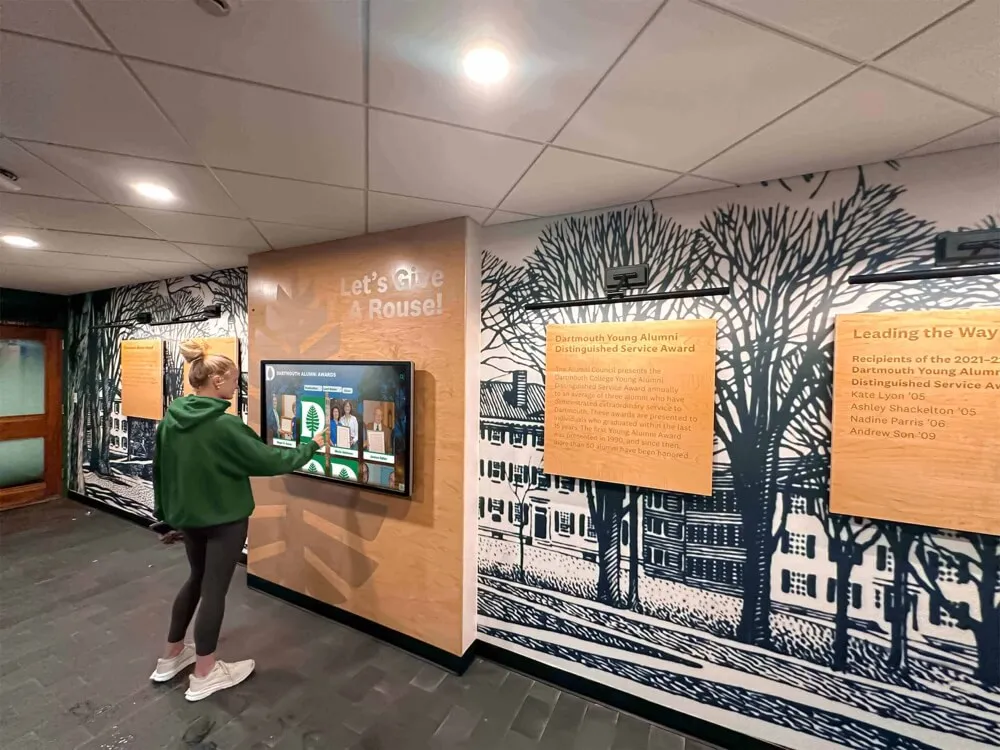
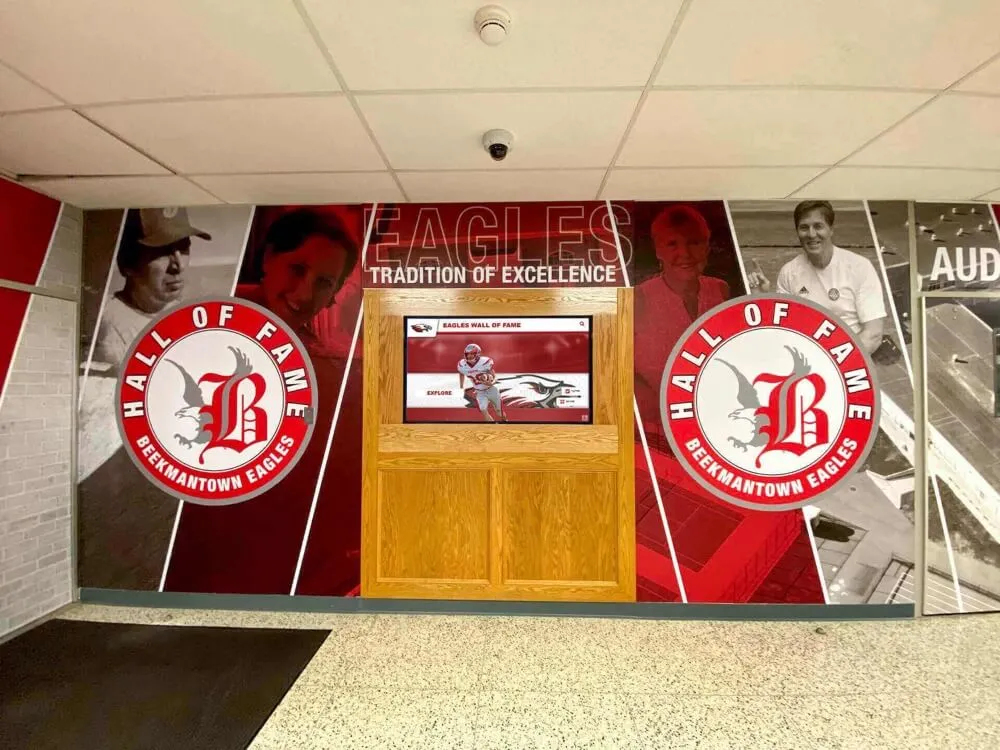
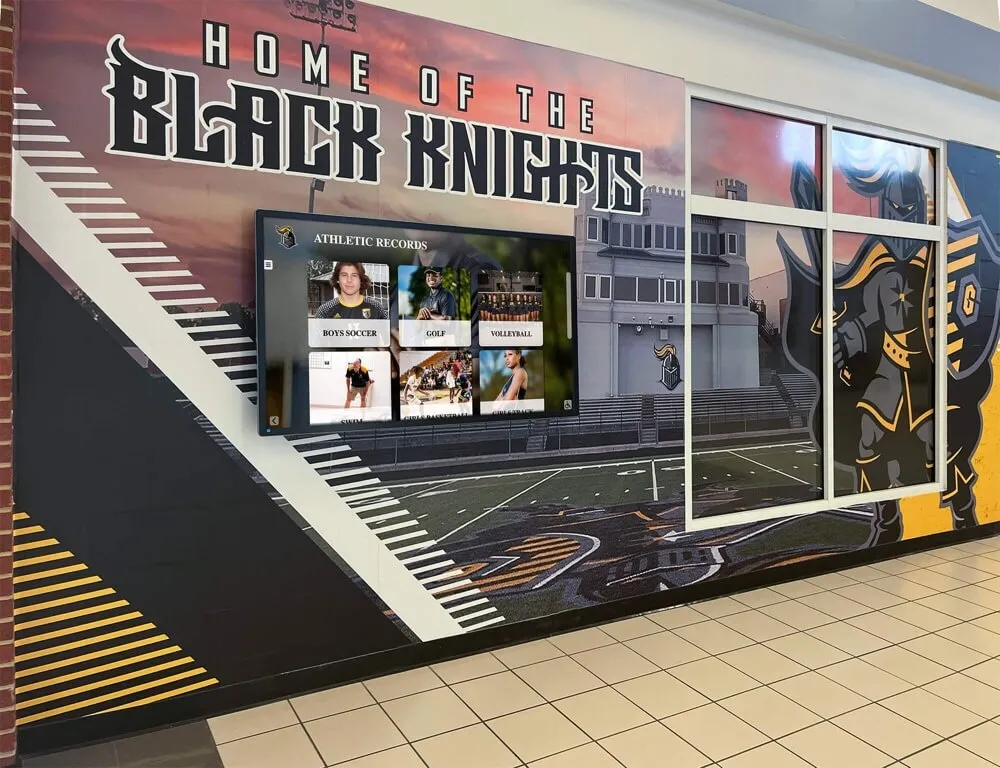
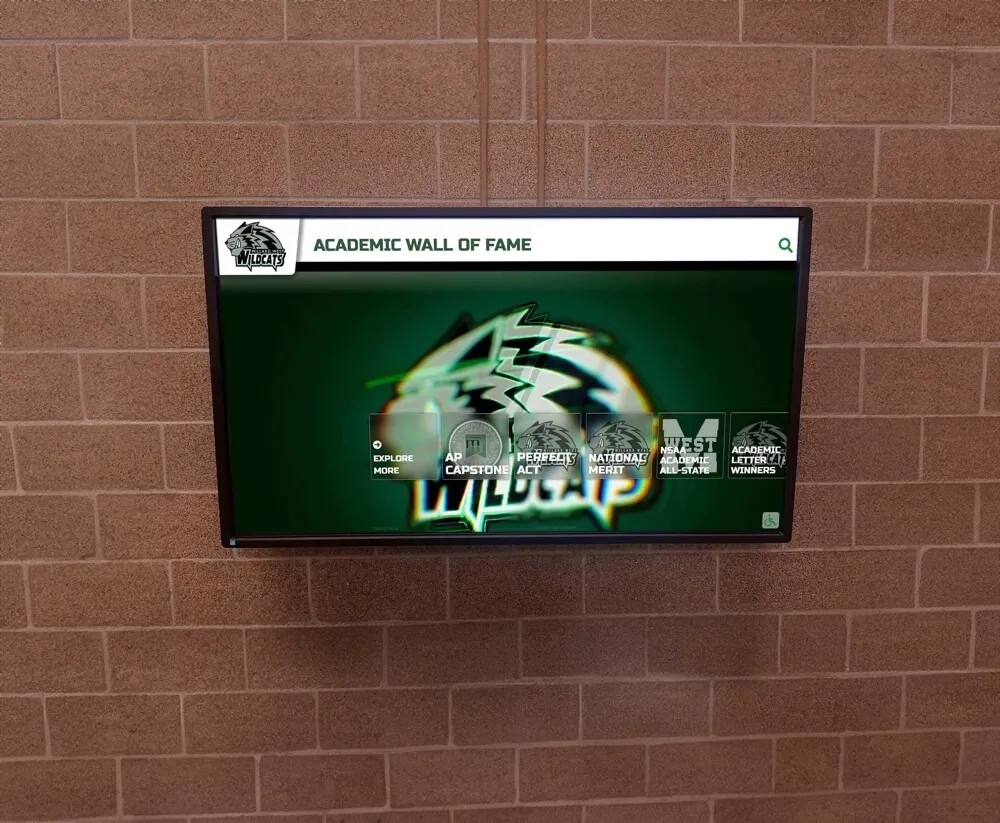
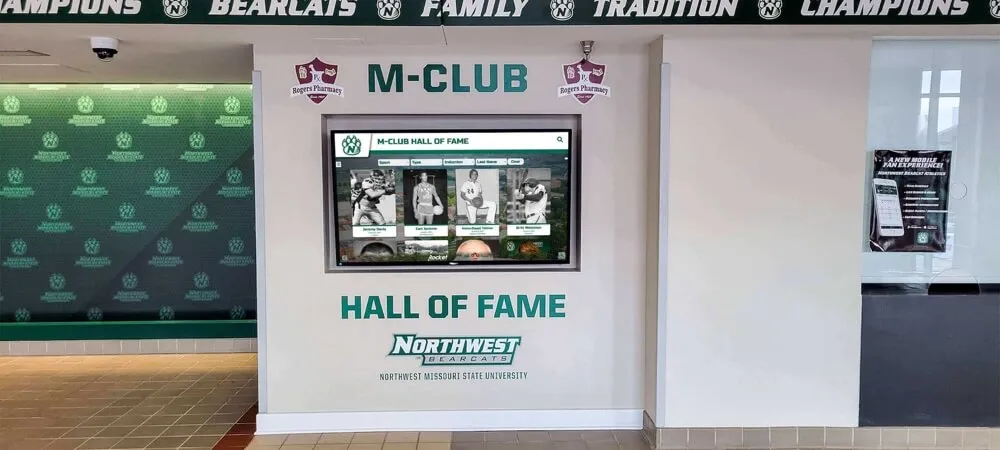
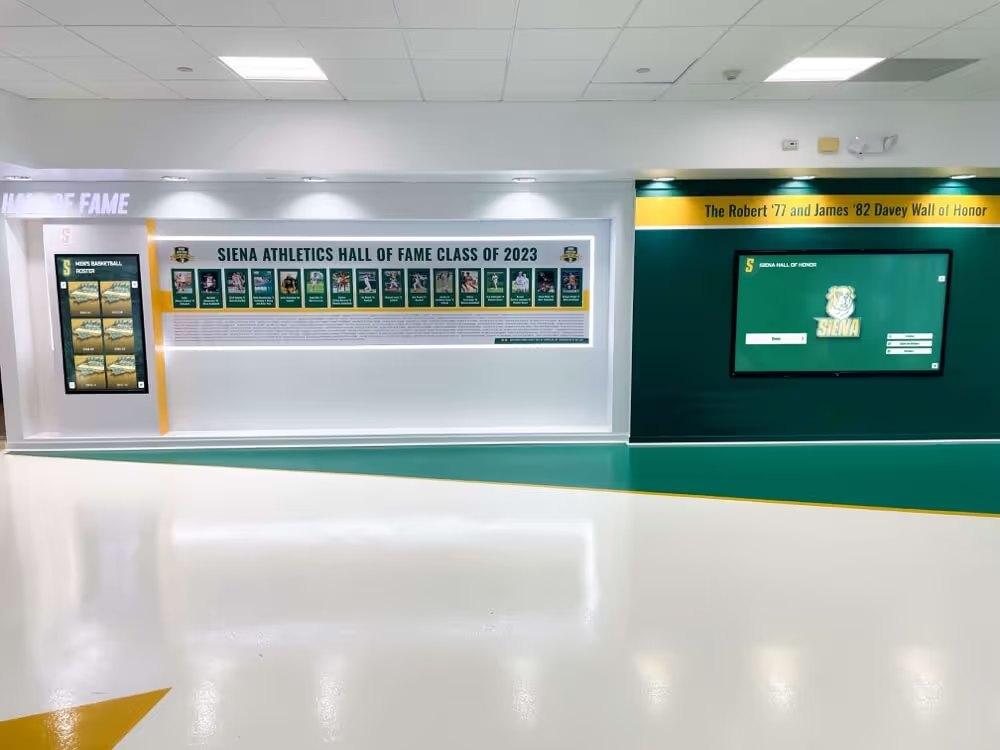
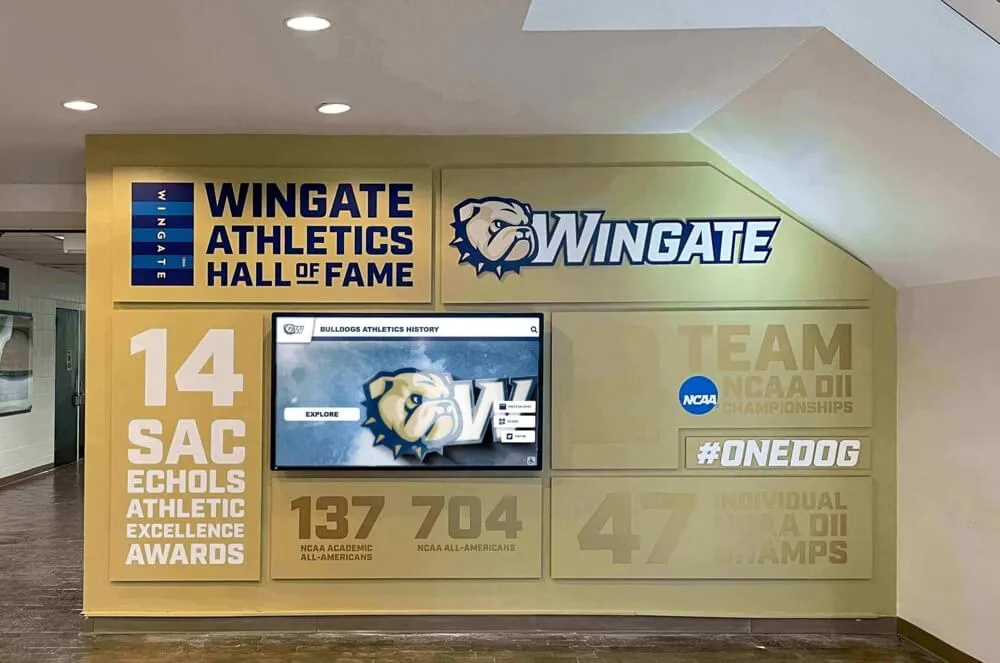
Multi-display networks allow universities to feature relevant alumni content in contextually appropriate campus locations
Model 3: Hybrid Physical-Digital Integration (Budget: $25,000-$45,000)
Optimal Use Cases:
- Universities with existing donor walls, trophy cases, or plaque installations worth preserving
- Limited wall space preventing expansion of physical recognition
- Desire to add multimedia storytelling without removing existing displays
- Phased budget allocation over 2-3 fiscal years
Implementation Approach:
- Position interactive touchscreen adjacent to existing physical recognition
- Create digital profiles for every individual recognized physically (preserve existing investment while adding depth)
- Use QR codes on physical plaques linking to expanded digital content
- Develop wayfinding signage: “Explore complete alumni stories on the interactive display →”
Content Strategy for Hybrid Models:
- Digital profiles expand on limited plaque information (professional bio, video interviews, career timelines, personal advice)
- Searchable database enables discovery beyond physical wall capacity
- Time-based rotation highlights “featured alumni” not yet inducted into physical hall (creates pipeline for future physical recognition)
- Virtual tours for remote alumni unable to visit campus physically
Technical Bridge Solutions:
- NFC tags embedded in physical plaques: visitors tap smartphones to view digital profile (requires NFC-enabled phone—not universal)
- Beacon technology: proximity sensors detect when visitors approach physical displays, trigger related content on nearby screens
- Interactive timeline integration: show how physical recognition wall evolved over decades, who was inducted when
Budget Allocation Example (3-Year Plan):
- Year 1: Install touchscreen system with initial 100 profiles ($18K hardware/software, $4K content development)
- Year 2: Add QR codes to existing plaques, create 150 additional digital profiles ($8K content, $1K QR codes)
- Year 3: Commission video interview series with 20 featured alumni, expand to mobile app ($12K video production, $6K app development)
Content Development Workflow: From Nomination to Publication
Sustainable university alumni wall programs require repeatable processes that don’t depend on heroic individual efforts. This workflow has scaled from 50-alumni programs to 2,000+ profile collections.
Nomination and Vetting Process (Weeks 1-4)
Step 1: Open Nomination Window
- Announce via email, alumni magazine, social media (2-3 month advance notice)
- Provide online nomination form (Google Forms, Microsoft Forms, Qualtrics)
- Required fields: nominee name, graduation year, nominator relationship, 100-word achievement summary
- Optional fields: nominee contact info, supporting documentation, photos
Step 2: Committee Review
- Convene selection committee representing diverse stakeholders (advancement staff, faculty, alumni board members, students)
- Distribute nominations with identifying information redacted (reduces bias)
- Scoring rubric (example):
- Impact significance (1-5): measurable influence on field/community
- Connection to institutional mission (1-5): demonstrates educational value
- Story potential (1-5): compelling narrative that inspires
- Diversity consideration (1-5): underrepresented populations, fields, geographies
- Select 2-3x more nominees than annual induction capacity (account for contact failures)
Step 3: Outreach and Acceptance
- Email selected nominees: congratulate, request participation, explain time commitment
- Allow 2-3 weeks response time (follow up twice before considering decline)
- Capture acceptance confirmations for official record keeping
Content Collection and Development (Weeks 5-12)
Step 4: Gather Raw Materials
- Send content questionnaire to accepted honorees:
- Educational background (degrees earned, areas of study, formative professors/mentors)
- Career progression (positions held, organizations, key achievements with dates)
- Awards and recognition (industry honors, publications, patents, media coverage)
- Community involvement (board service, volunteer activities, philanthropic leadership)
- Advice for current students (3-5 specific recommendations)
- Personal photo collection (professional headshots, action shots, historical images)
Step 5: Biographical Writing
- Draft 300-500 word narratives in consistent voice (third-person past/present tense)
- Structure: opening hook (most compelling achievement) → educational foundation → career journey → current status → lasting impact
- Incorporate specific metrics: “Founded company that grew to 200 employees and $50M revenue” not “successful entrepreneur”
- Link institutional experience to outcomes: “Credits field research course with Professor Johnson for sparking 30-year environmental advocacy career”
Step 6: Fact-Checking and Legal Review
- Verify graduation year against registrar records (remarkably common errors)
- Confirm job titles and organizations via LinkedIn, official bios, company websites
- Check award/honor authenticity through issuing organization databases
- Legal review for potentially sensitive content (political activities, controversial statements)
- Send draft to honoree for review—allow 10 business days for feedback
Step 7: Media Production
- Photo specs: minimum 1200×1600 pixels, 300 DPI, JPEG format
- Video specs: 1920×1080 resolution minimum, 2-5 minute duration, H.264 codec, burned-in captions required
- Video interview best practices: professional lighting, lapel microphone audio, neutral background
- Caption all video content (not just for accessibility—85% of social video watched without sound)
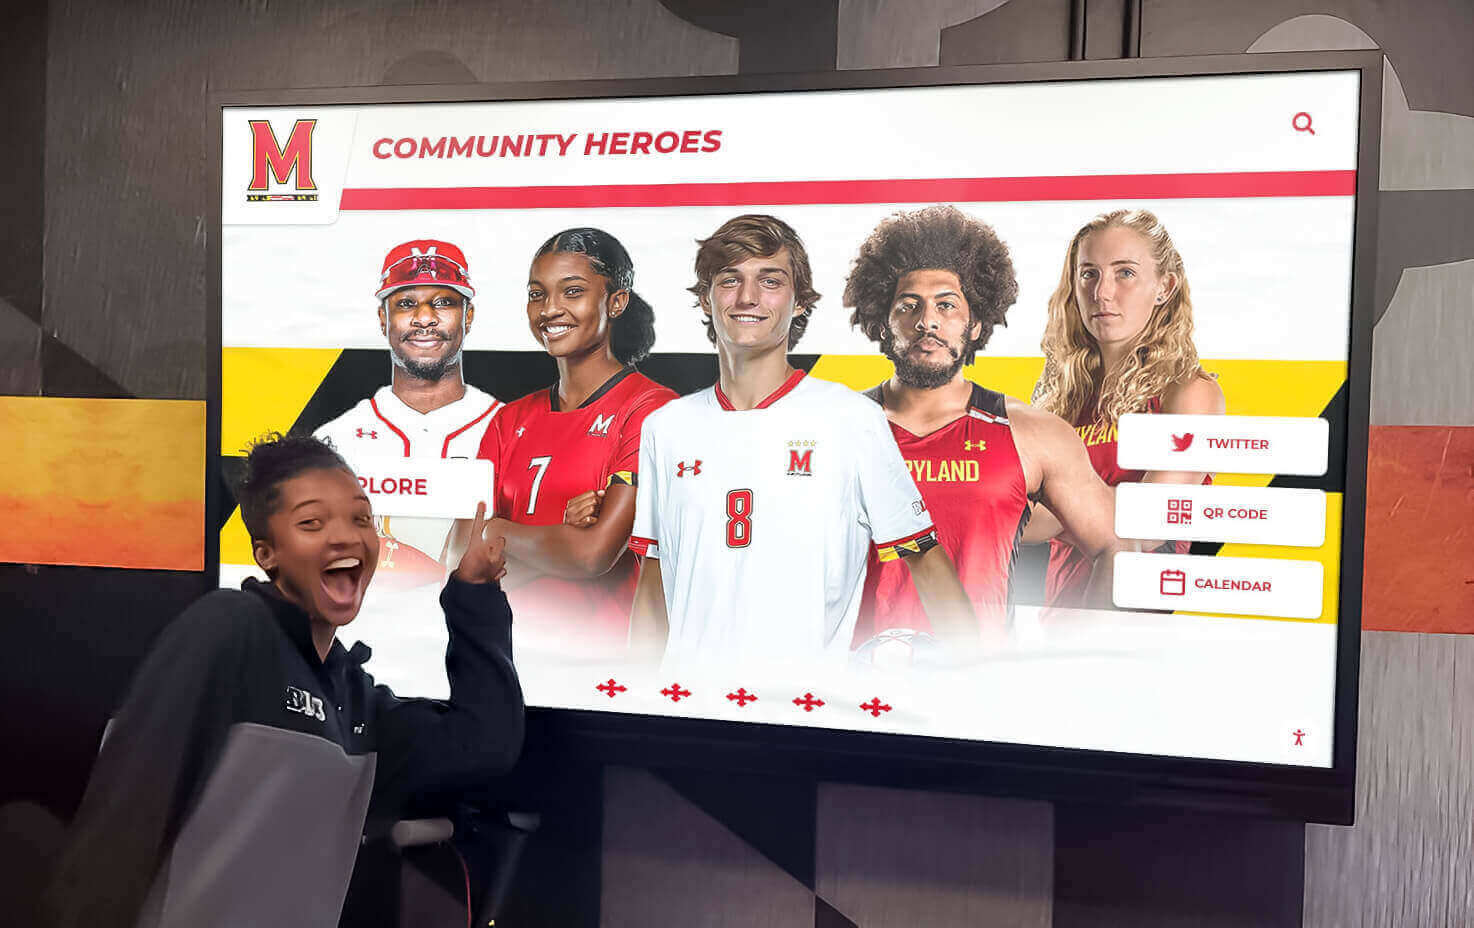
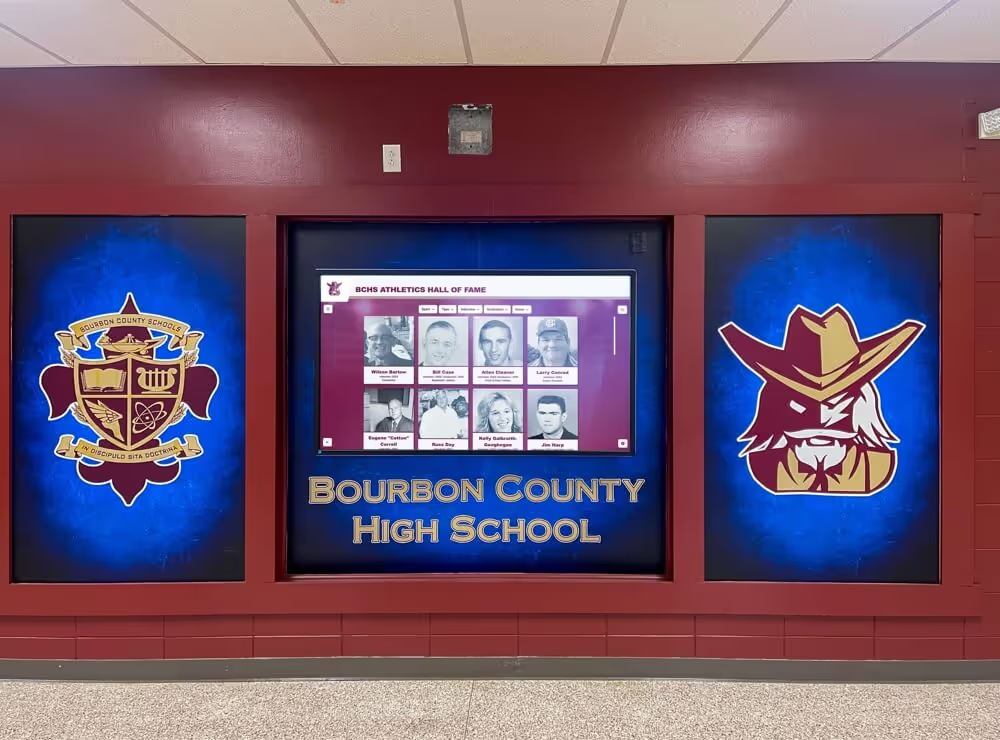
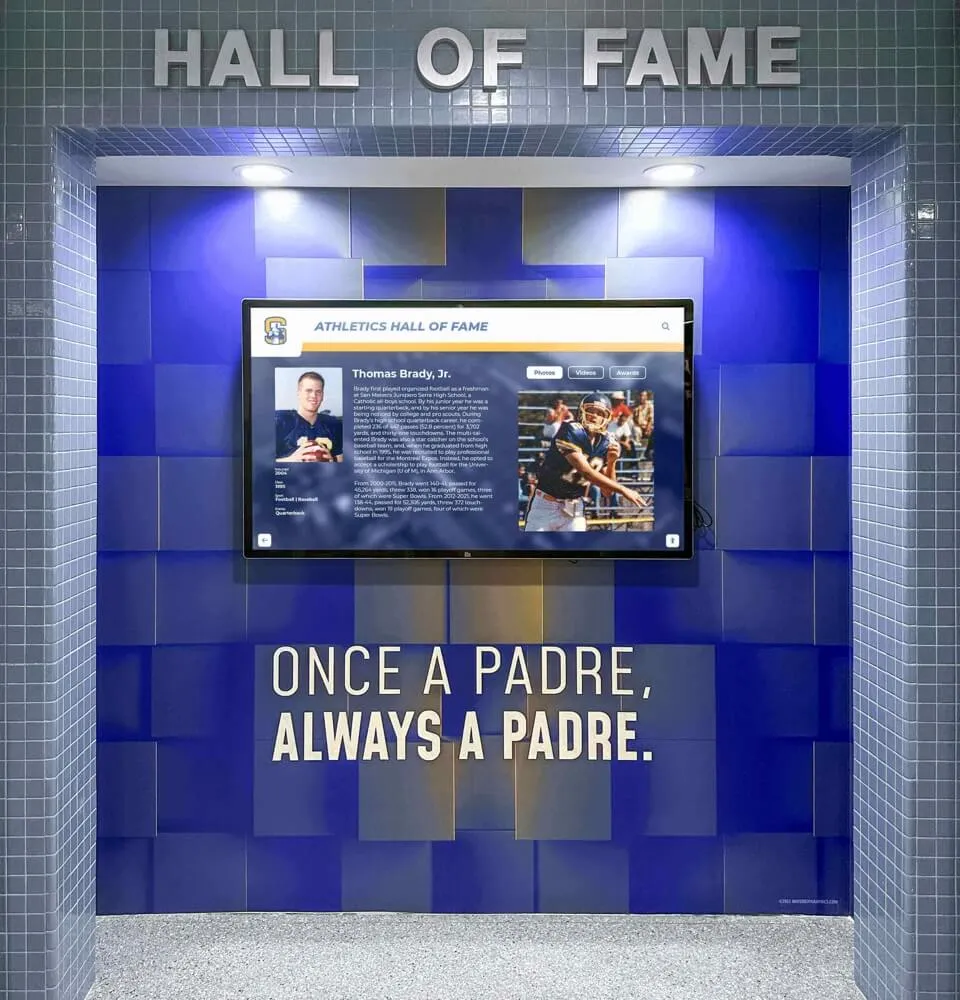
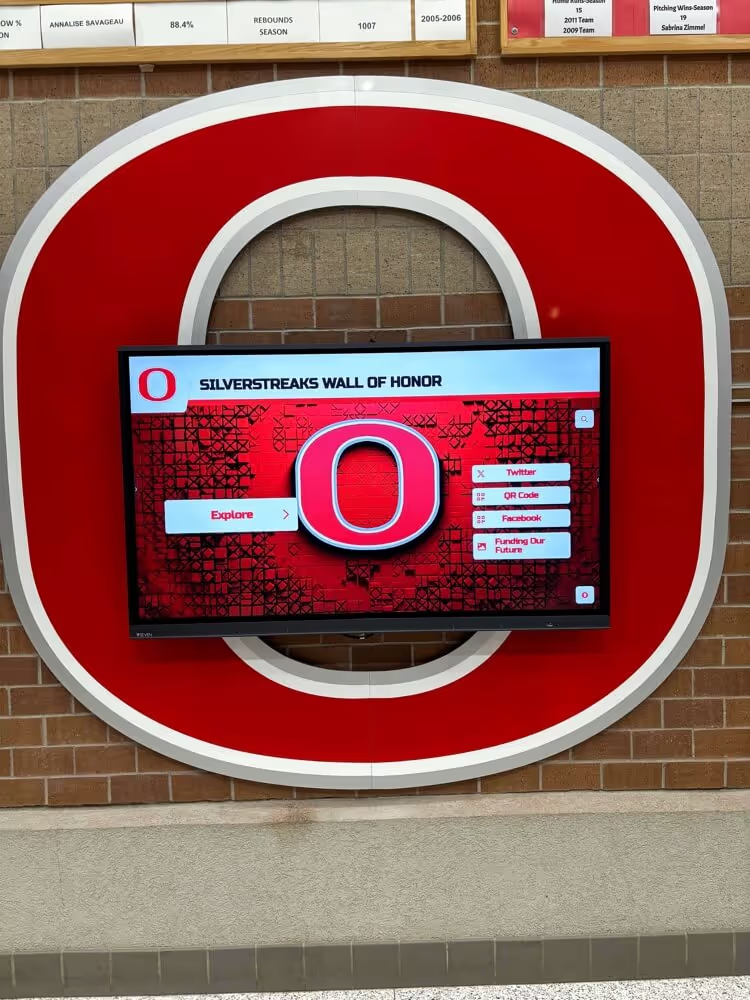
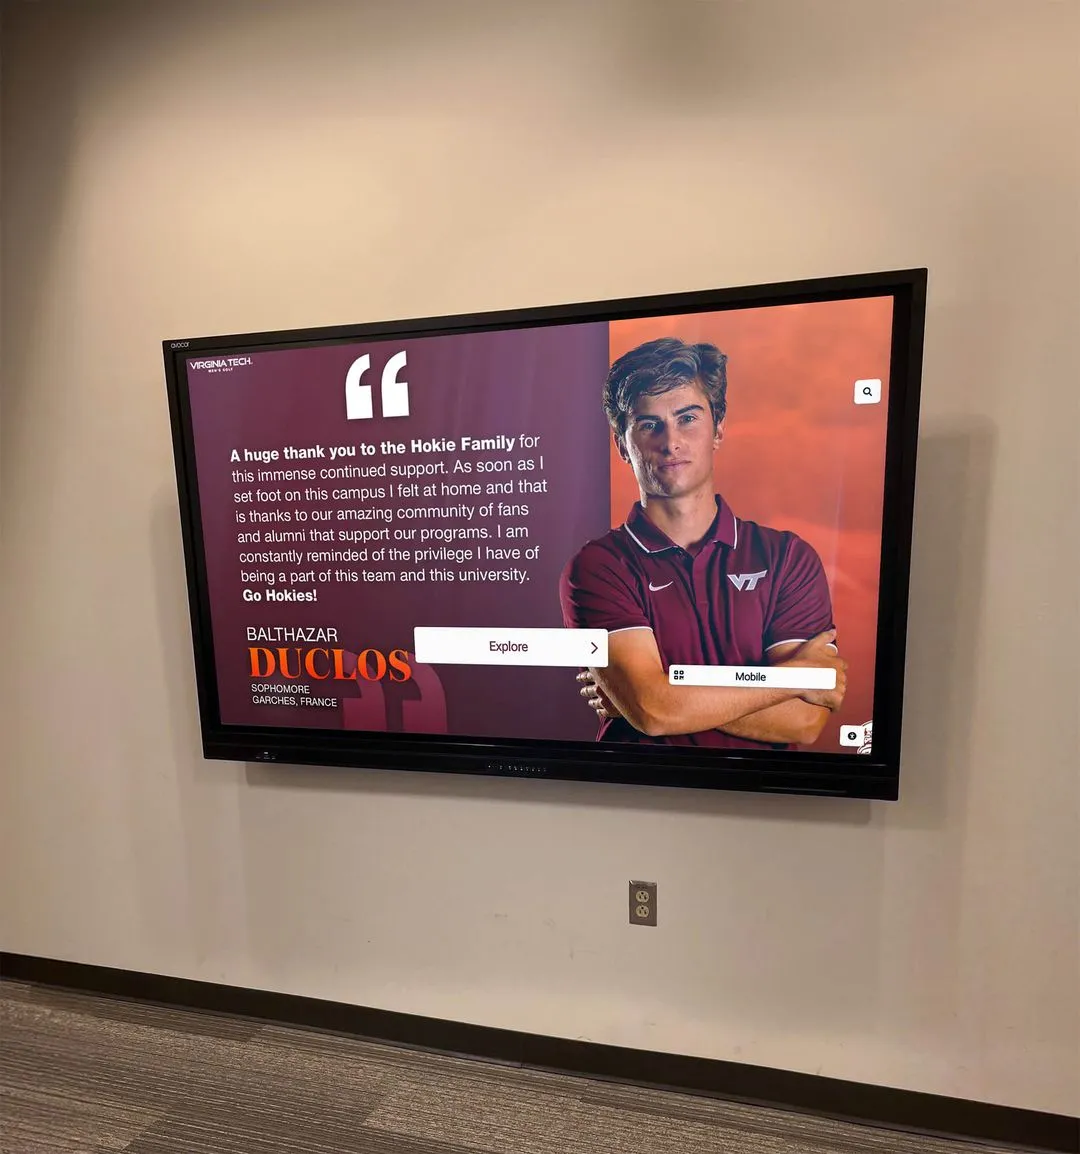
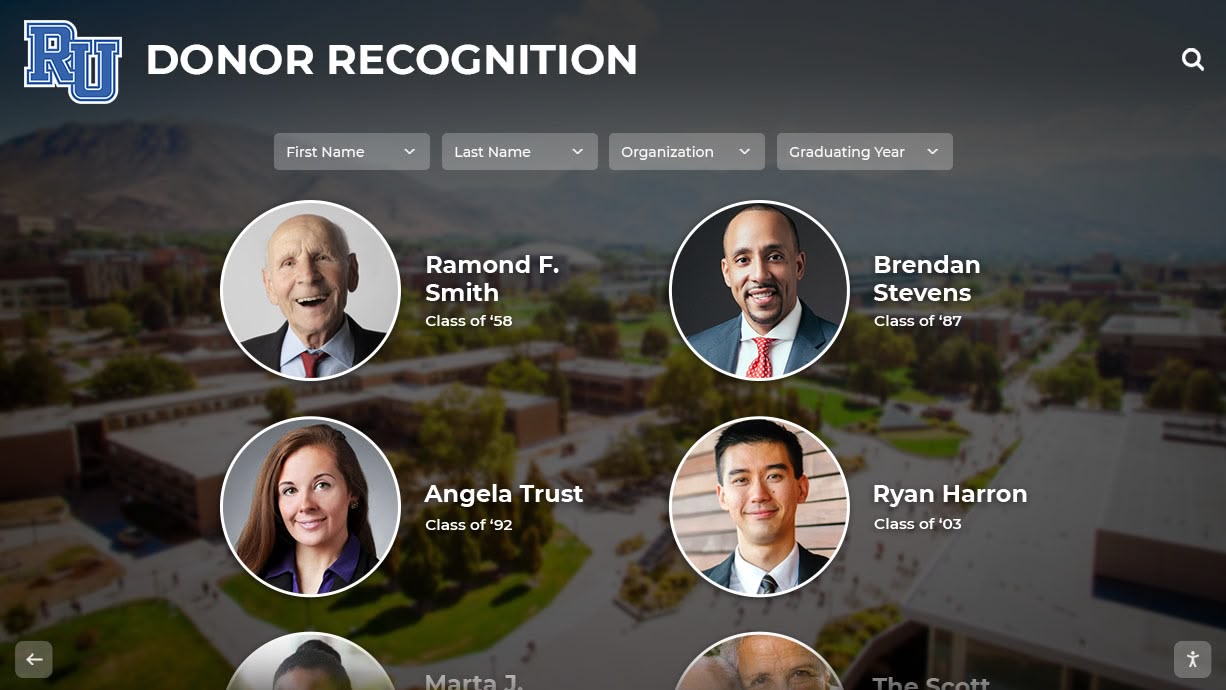
Rich multimedia content makes alumni profiles engaging resources for career exploration and institutional pride building
Publication and Promotion (Weeks 13-16)
Step 8: Technical Publishing
- Upload content to CMS following templates
- Assign taxonomy tags: graduation decade, school/college, achievement category, geographic region
- Create searchable metadata: alternate name spellings, maiden names, nicknames
- Generate QR code for each profile if supporting printed materials
- Preview on actual hardware before public launch (desktop preview doesn’t catch touchscreen interaction issues)
Step 9: Launch Campaign Planning
- Coordinate unveiling with high-traffic event (homecoming, commencement weekend, reunion)
- Create press release for local media if honorees include prominent community figures
- Schedule social media posts: feature 1-2 profiles weekly for 3 months post-launch
- Email campaign to inductee’s graduation class: “Your classmate [Name] has been inducted into the Alumni Hall of Honor”
- Update campus tour scripts: train tour guides to demonstrate interactive display during prospective student visits
Step 10: Measurement and Iteration
- Track baseline engagement metrics immediately post-launch
- Survey induction ceremony attendees: satisfaction scores, suggestions for improvement
- Monitor help desk tickets or user-reported issues with search/navigation
- Document staff time invested per profile (refine process to reduce hours over subsequent cycles)
Technical Specifications Deep-Dive: Avoiding Common Pitfalls
University IT procurement often defaults to consumer electronics specs. These institutional requirements differ substantially—cheap shortcuts become expensive problems.
Why Consumer TVs Fail in Public Spaces
Lifespan and Warranty Issues:
- Consumer TVs: rated 20,000-30,000 operating hours (3.4 years at 24/7 operation)
- Commercial displays: rated 50,000-100,000 hours (11+ years at 16/7 operation)
- Consumer warranties void when used commercially (check fine print: “residential use only”)
- Commercial displays include on-site service (consumer models require shipping to depot—weeks of downtime)
Image Retention and Burn-in:
- Static content (logos, navigation elements) create permanent ghost images on consumer displays after 6-18 months
- Commercial panels incorporate pixel-shift technology and image retention prevention
- If using consumer displays despite warnings: enable built-in screensaver, rotate content frequently
Heat Management:
- Consumer TVs lack ventilation for enclosed kiosks or recessed installations
- Overheating triggers thermal shutdowns—appears as intermittent random reboots
- Require 3-6 inches clearance on all ventilation sides (check service manual for exact specs)
Network Security and IT Compliance
Firewall Configuration Requirements:
- Outbound HTTPS (port 443) to content delivery networks—required for cloud-based systems
- Deny all inbound connections to display devices (management occurs via cloud platform, no direct access needed)
- Whitelist vendor-specific domains if content filtering too aggressive (provide list to IT for approval)
Guest Network Considerations:
- Display devices don’t require access to internal university resources (student records, email, file shares)
- Place on guest network or isolated VLAN—reduces attack surface if device compromised
- Document MAC addresses for network access control lists
Software Update Policies:
- Automatic updates (firmware, OS, application): specify update windows during low-traffic hours
- Allow vendor remote access for troubleshooting: define acceptable access windows, require advance notification
- Patch management: critical security updates within 30 days, feature updates quarterly maximum
ADA Compliance Requirements
Physical Accessibility Standards:
- Touchscreen center point height: 48 inches maximum above finished floor (ADA 4.2.5)
- Operable parts (touch interface): require one-hand operation, no tight grasping/pinching/twisting
- Clear floor space: 30"×48" minimum positioned for forward or parallel approach (ADA 305.3)
- Knee and toe clearance if forward approach: 27" high minimum, 25" deep minimum (ADA 306)
Digital Accessibility Standards:
- WCAG 2.1 Level AA compliance for all interactive elements
- Color contrast ratios: 4.5:1 minimum for normal text, 3:1 for large text (18pt+)
- All functionality available via touch (no hover-only interactions that fail on touchscreens)
- Text resize up to 200% without loss of content or functionality
- Video captions: accurate, synchronized, 99%+ accuracy threshold
- Alternative text for images: describe meaningful content, skip purely decorative elements
Testing Protocol:
- Conduct usability testing with diverse users including wheelchair users, vision impairments, motor limitations
- Use automated accessibility checkers (axe DevTools, WAVE) but don’t rely solely on automated tools—manual testing essential
- Document accessibility features in tour guide training, website descriptions
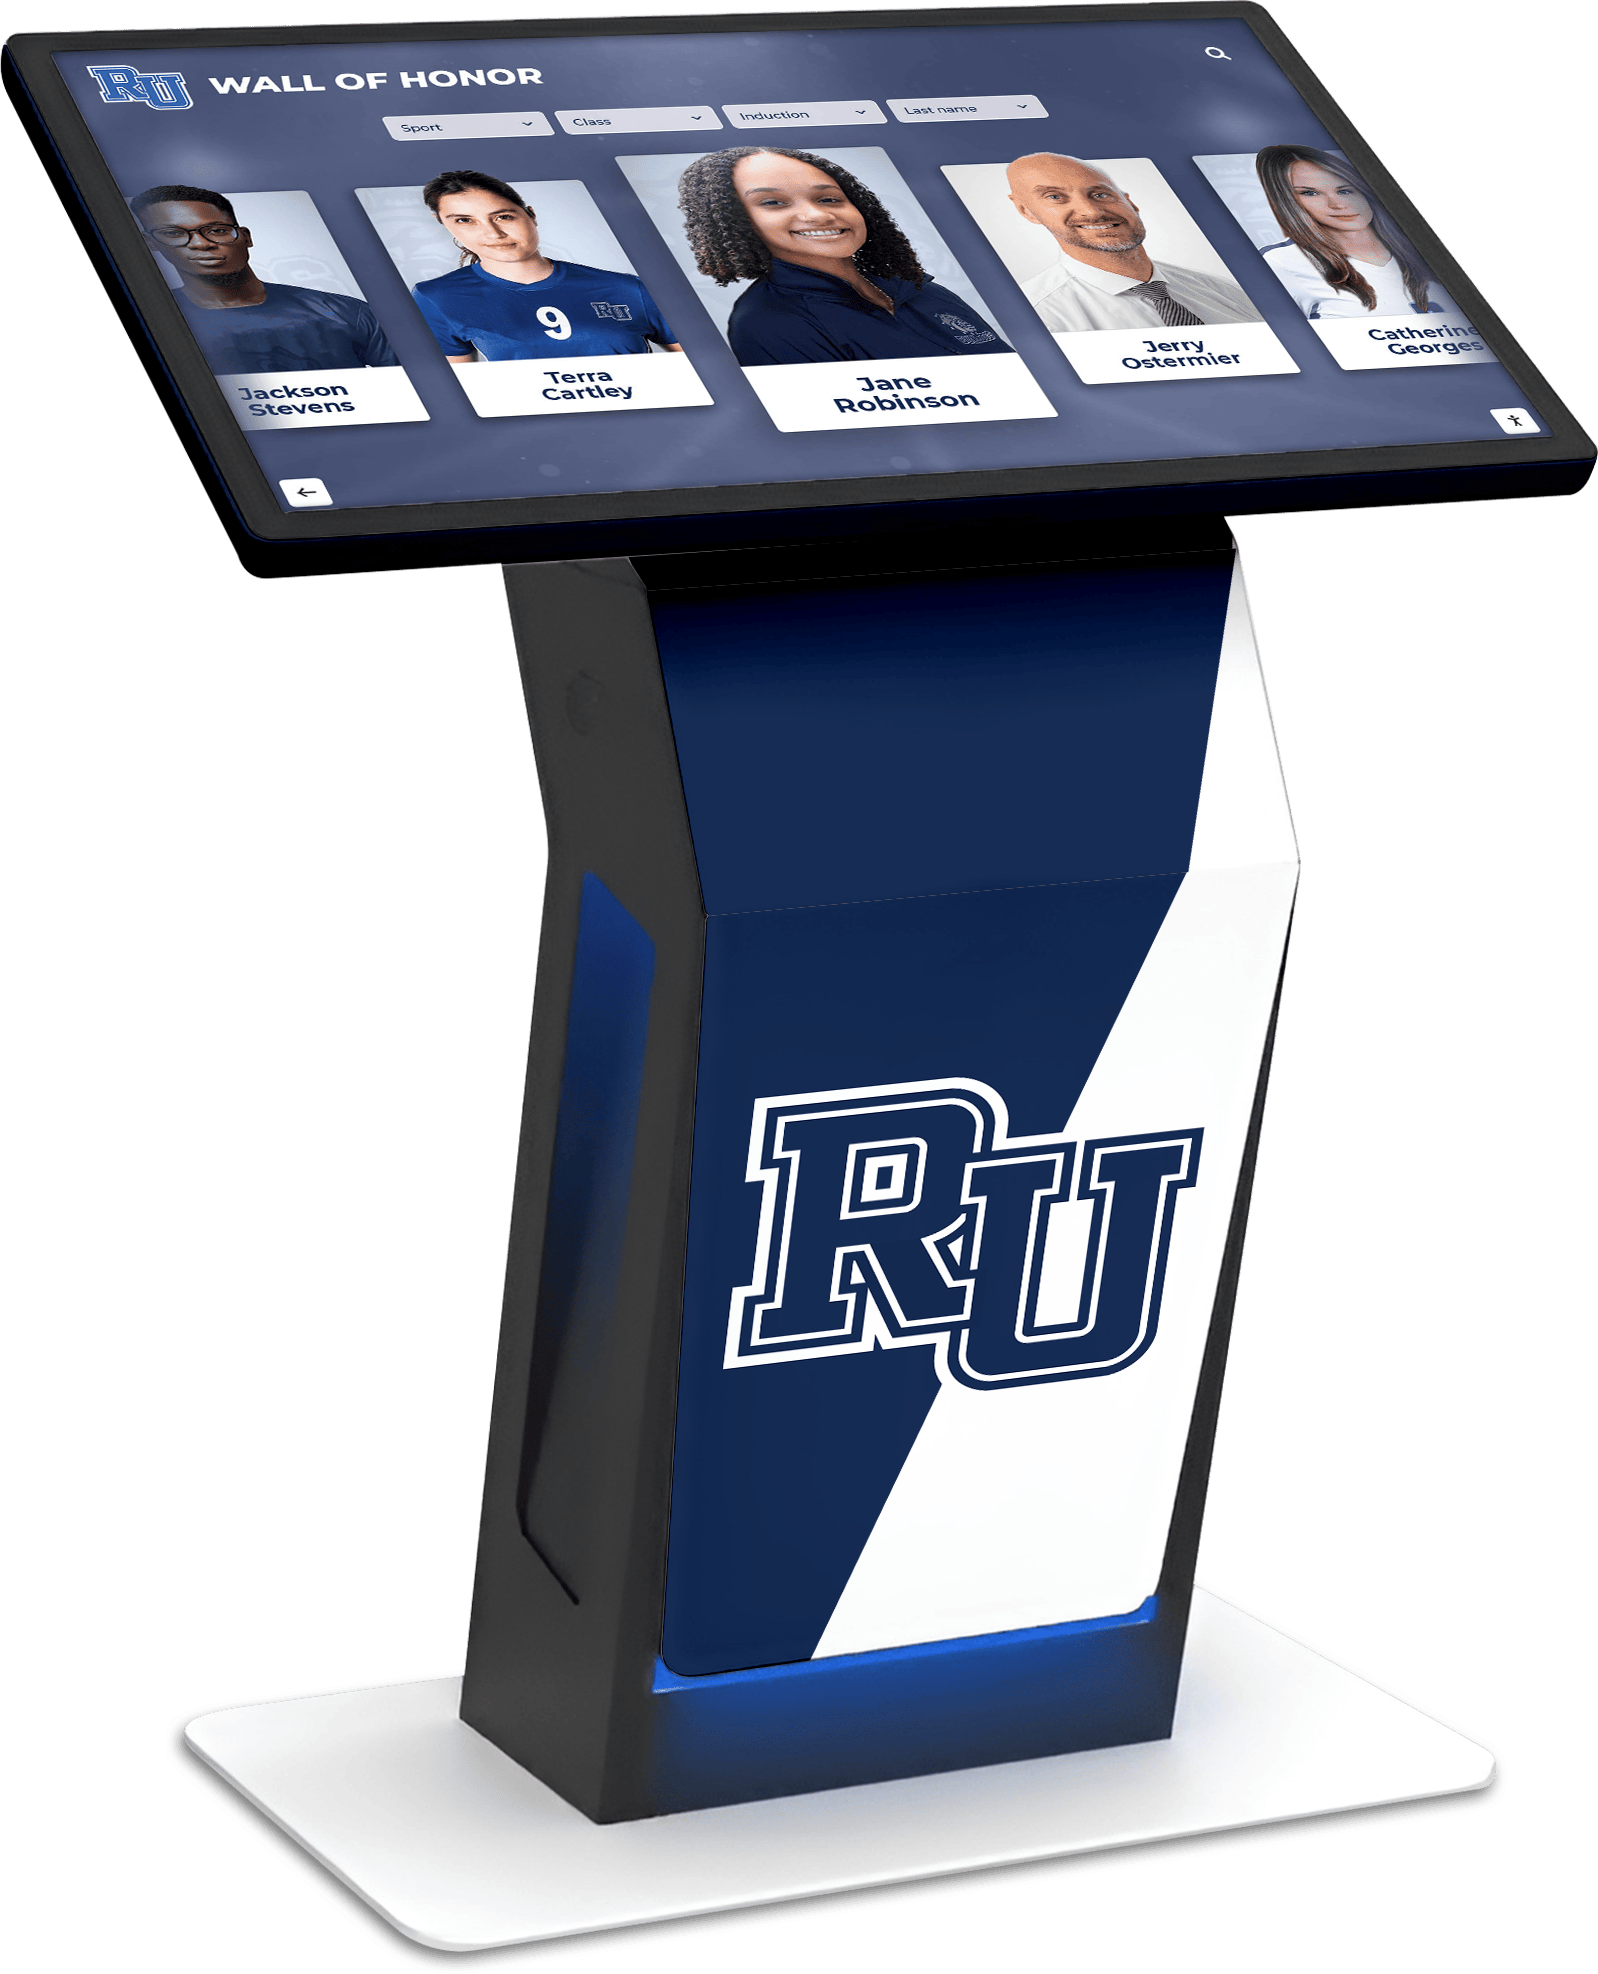
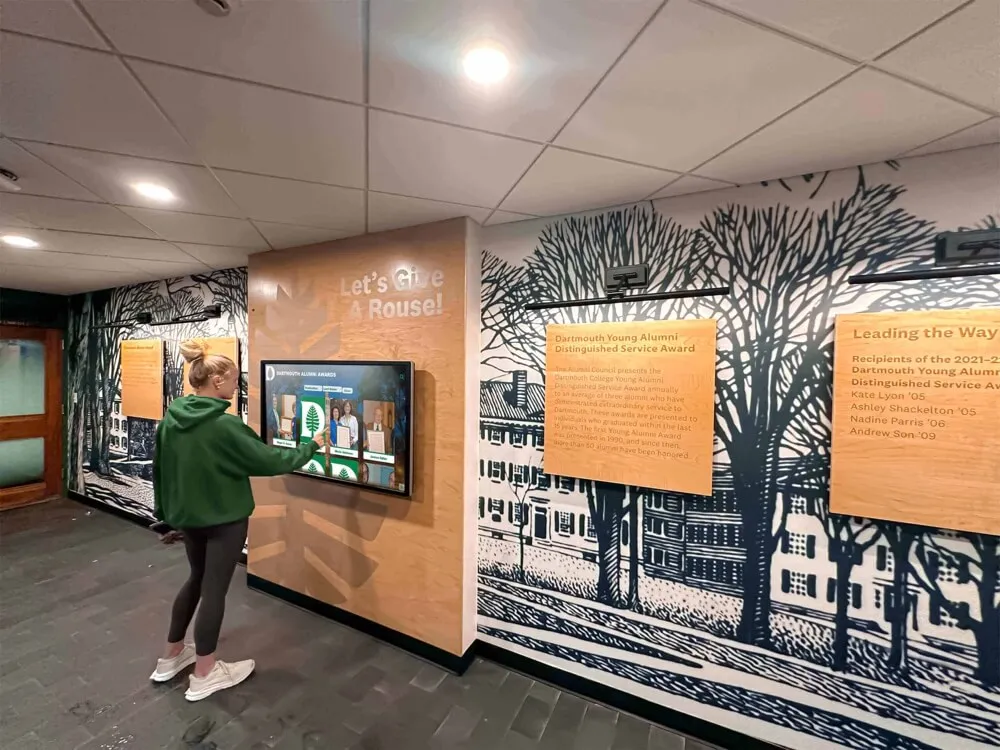
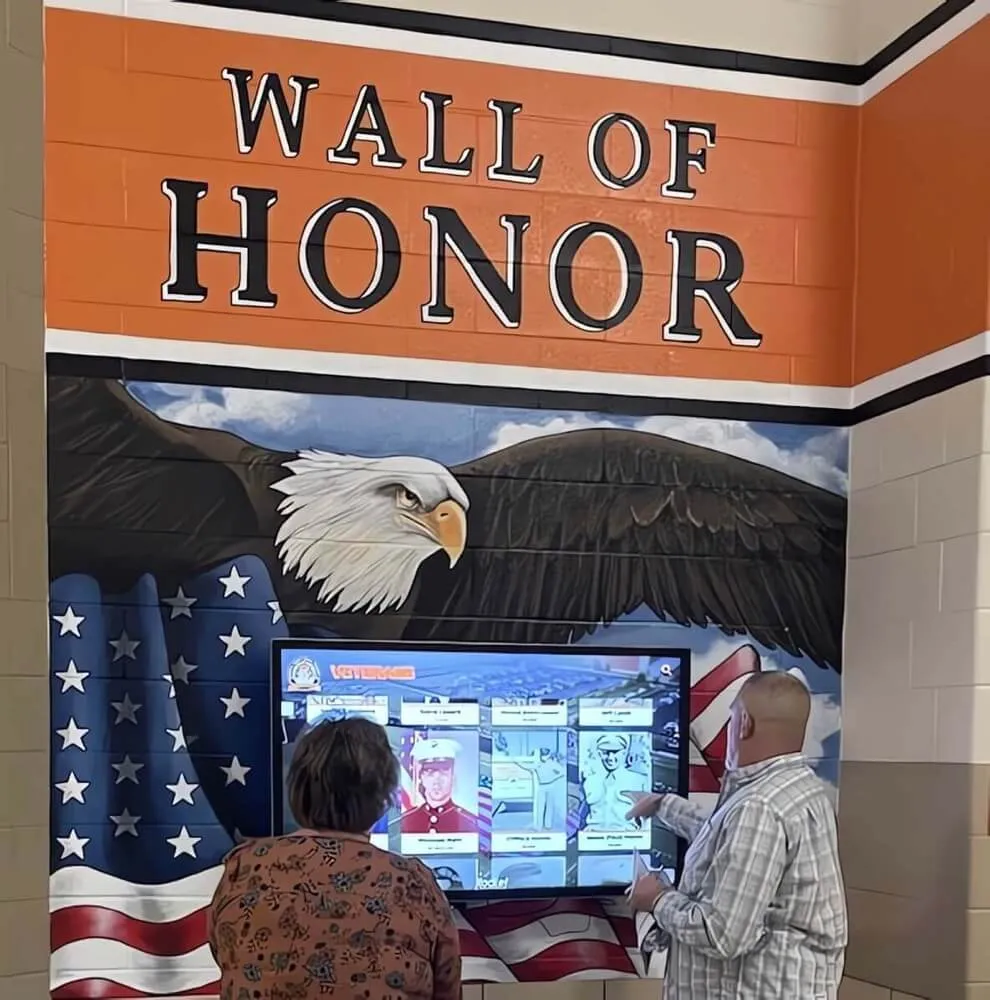
ADA-compliant installations ensure all campus community members can access alumni recognition content
Budget Calculator and Total Cost of Ownership
Use this framework to build business case documentation for leadership approval. All costs USD, based on 2024-2025 vendor pricing for higher education institutions.
Capital Budget (Initial Implementation)
Hardware Components:
| Component | Budget Range | Typical Mid-Range |
|---|---|---|
| 55" Commercial Touchscreen | $3,500-$6,500 | $4,800 |
| Mounting Hardware (wall or kiosk) | $400-$2,500 | $1,200 |
| Media Player / Computing | $400-$1,200 | $700 |
| Cabling and Infrastructure | $200-$1,500 | $650 |
| Hardware Subtotal | $4,500-$11,700 | $7,350 |
Software and Services:
| Component | Budget Range | Typical Mid-Range |
|---|---|---|
| CMS Platform Setup Fee | $1,500-$4,000 | $2,500 |
| First Year Subscription | $2,400-$6,000 | $3,600 |
| Professional Installation | $1,200-$3,500 | $2,000 |
| Training (2 sessions) | $800-$1,500 | $1,000 |
| Software/Services Subtotal | $5,900-$15,000 | $9,100 |
Initial Content Development:
| Component | Budget Range | Typical Mid-Range |
|---|---|---|
| Professional Photography (20 profiles) | $1,500-$4,000 | $2,500 |
| Biographical Writing | $2,000-$5,000 | $3,000 |
| Video Production (5 featured profiles) | $3,000-$8,000 | $5,000 |
| Content Subtotal | $6,500-$17,000 | $10,500 |
Total Initial Investment (Single Display System): $16,900 - $43,700 Typical Mid-Range Project: $27,000
Annual Operating Budget (Years 2-10)
| Expense Category | Annual Cost | 10-Year Total |
|---|---|---|
| Software Subscription | $3,600 | $36,000 |
| Content Updates (4 hrs/month × $40 fully-loaded rate) | $1,920 | $19,200 |
| Electricity ($45/year at 16/7 operation) | $45 | $450 |
| Maintenance/Repairs (5% hardware replacement fund) | $370 | $3,700 |
| Professional Photography (annual induction ceremony) | $800 | $8,000 |
| Annual Operating Total | $6,735 | $67,350 |
10-Year Total Cost of Ownership: $94,350 Cost Per Profile (200 profiles over 10 years): $472
ROI Calculation Worksheet:
- Documented giving increase from recognized alumni: ___%
- Number of recognized alumni: ___
- Average gift size: $___
- Incremental giving: Alumni × Recognition lift % × Gift size = $___
- System costs $27K + $67K operating = $94K over 10 years
- Break-even requires: $94K ÷ ___ alumni = $___ incremental giving per alumni over 10 years
Example: 200 recognized alumni with 15% giving increase and $500 average gift yields $15,000 annually or $150K over 10 years—60% ROI on system investment.
Implementation Timeline and Project Plan
Realistic timelines prevent frustration and budget overruns. Universities typically underestimate decision-making cycles and content development duration.
Phase 1: Planning and Requirements (Weeks 1-8)
Weeks 1-2: Stakeholder Alignment
- Schedule kickoff meeting with advancement, IT, facilities, alumni association leadership
- Define roles: project sponsor, project manager, content manager, technical liaison
- Establish decision-making authority and budget approval process
- Create communication plan for keeping stakeholders informed
Weeks 3-4: Site Assessment and Technical Discovery
- Complete site assessment checklist (see earlier section)
- Document network connectivity, power availability, physical constraints
- Photograph proposed location from multiple angles
- Meet with IT team: review network security policies, firewall requirements, VLAN options
- Meet with facilities team: confirm installation approach, mounting requirements, accessibility compliance
Weeks 5-6: Requirements Documentation
- Compile findings into formal requirements document
- Specify hardware requirements (display size, resolution, touch technology)
- Define software features (search, filtering, multimedia support, CMS requirements)
- Create content strategy document (profile structure, submission workflows, update frequency)
- Document accessibility requirements and testing plan
Weeks 7-8: Vendor Selection
- Issue RFP or request detailed proposals from 3+ vendors
- Evaluate proposals against requirements checklist
- Check references: call 2-3 institutions using each platform
- Schedule vendor demonstrations: bring key stakeholders, test actual user workflows
- Negotiate pricing, service level agreements, training inclusions
Phase 2: Content Development and Technical Buildout (Weeks 9-20)
Weeks 9-12: Initial Content Creation
- Identify first 50-100 alumni profiles (leverage existing hall of fame, major donors, notable recent alumni)
- Collect biographical data via questionnaire
- Commission professional photography for featured profiles
- Draft biographical narratives following template
- Fact-check content accuracy
Weeks 13-16: System Configuration
- Vendor configures CMS with institutional branding
- Create user accounts, set permissions (admin, editor, reviewer roles)
- Import initial profile data via CSV bulk upload
- Configure search parameters, filter categories
- Customize interface layout and navigation
Weeks 17-20: Installation and Testing
- Schedule installation during low-traffic period (winter break, summer session)
- Install mounting hardware, connect power and network
- Configure display device settings (brightness, sleep timers, accessibility features)
- Load content management application
- Conduct user acceptance testing with diverse testers
- Document any bugs or issues for resolution
Phase 3: Launch and Optimization (Weeks 21-28)
Weeks 21-22: Soft Launch and Training
- Activate system for limited audience (advancement staff, student workers)
- Gather feedback on navigation, search effectiveness, content quality
- Conduct administrator training: content updates, media uploads, user management
- Train tour guides, event staff on demonstrating system to visitors
Weeks 23-24: Public Launch Campaign
- Coordinate unveiling event during high-attendance occasion
- Send email campaigns to alumni: announce new recognition platform
- Post social media content featuring selected profiles
- Issue press release if including prominent honorees
- Update website with embedded version or link to standalone web platform
Weeks 25-28: Post-Launch Monitoring and Optimization
- Monitor usage analytics daily for first two weeks
- Identify most-searched names (prioritize creating profiles if not yet included)
- Review user session recordings to spot navigation confusion
- Gather informal feedback from campus community
- Document lessons learned for future profile development cycles
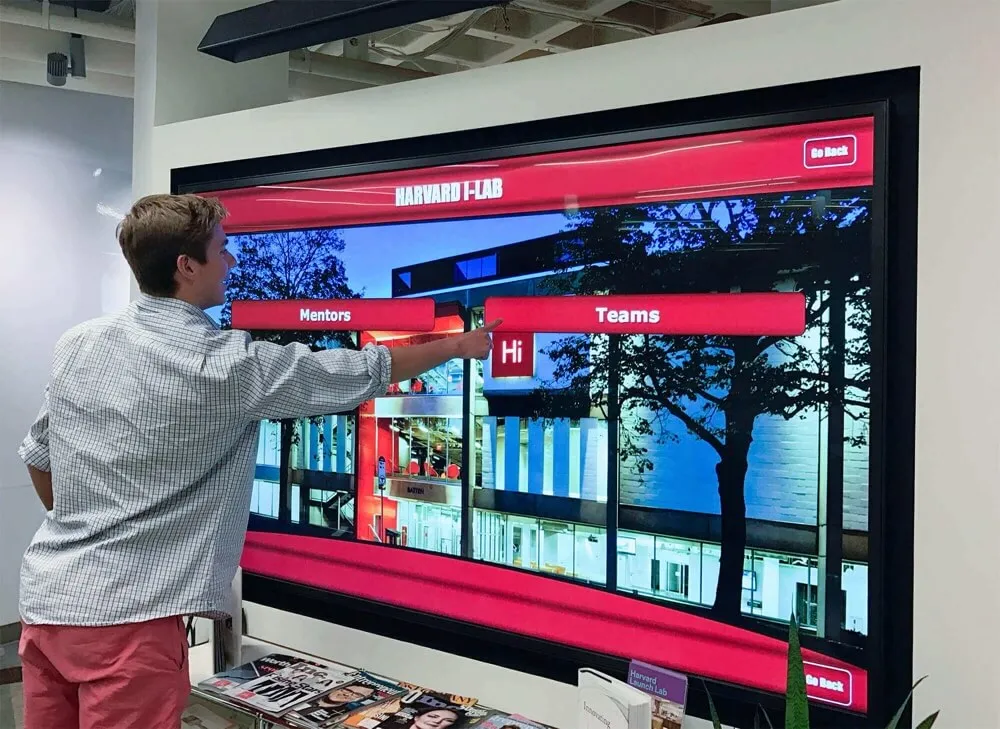
Strategic launch events maximize visibility and create momentum for ongoing engagement with university alumni walls
Measuring Success: Engagement Analytics and Advancement Impact
Digital recognition systems generate measurable data that traditional plaques never could. These metrics demonstrate ROI and guide continuous improvement.
Physical Display Engagement Metrics
Usage Volume Indicators:
- Unique daily sessions (distinct user interactions separated by 30+ minutes inactivity)
- Session duration distribution (percentage spending: <1 min, 1-3 min, 3-5 min, 5+ min)
- Profiles viewed per session (depth of engagement)
- Peak usage times (hour-by-hour heatmap) → informs content update scheduling
- Day-of-week patterns (weekday vs weekend vs event days)
Content Performance Metrics:
- Most-viewed profiles (top 25) → identify what content resonates
- Search query volume and keywords → reveals what visitors want to find
- Filter usage patterns (which categories/years users browse most)
- Video play rates and completion percentages
- Dead-end navigation paths → spots where users get stuck or confused
Technical Health Indicators:
- System uptime percentage (target: 99.5%+)
- Error rates and types
- Average page load times
- Network connectivity drops
- Storage capacity utilization (especially for video-heavy content)
Web Platform Analytics
Traffic Sources and Geographic Distribution:
- Direct traffic vs. social referrals vs. search engine discovery
- Geographic locations of visitors (separate campus IPs from alumni locations)
- Device types (desktop vs mobile vs tablet) → informs responsive design priorities
- Browser types → identifies compatibility issues
User Behavior Analysis:
- New vs. returning visitors (indicates whether content brings people back)
- Bounce rate on landing pages (high bounce rate signals relevance or UX issues)
- Conversion rates for CTAs (event registration, donation links, contact form submissions)
- Time on site and pages per session
Alumni-Specific Engagement:
- Profile shares via social media (indicates pride in being featured)
- Email click-through rates when featuring specific alumni
- Alumni who update their own profiles via self-service portal
- Alumni who nominate peers for recognition
Advancement Outcome Metrics
Giving Performance Indicators:
- Compare giving rates: recognized alumni vs. non-recognized cohorts (control for other factors like class year, major, previous giving)
- Average gift size differences between groups
- Multi-year giving retention rates
- Major gift pipeline growth (qualified prospects identified through recognition research)
- Planned giving inquiries correlated with recognition timing
Event Participation Lift:
- Reunion attendance rates in years before and after recognition program launch
- Homecoming event registration changes
- Virtual event attendance from geographically distant alumni
- Alumni-student mentorship program sign-ups
Database Quality Improvements:
- Email deliverability rate changes (outdated addresses updated when alumni claim profiles)
- Phone number accuracy improvements
- Employment information currency (profiles prompt alumni to update job changes)
- Engagement scoring increases in CRM (recognition activities generate touchpoints)
Example Measurement Dashboard Format:
Q4 2024 Alumni Wall Engagement Report

Physical Display (Student Union):
- 1,847 unique sessions (↑23% vs Q3)
- Average session: 3m 42s
- 4.2 profiles viewed per session
- Top searches: "class of 1995", "engineering", "football"
- Peak times: Monday 12-1pm, Thursday 5-6pm

Web Platform:
- 3,206 unique visitors (68% from non-campus IPs)
- 2.1 pages per session
- 42% mobile traffic
- 156 profile shares on LinkedIn
- 23 users updated their own profiles

Advancement Impact:
- Recognition program participants: 15.7% giving rate vs 11.2% institution average (+40% lift)
- 12 major gift conversations initiated via recognition research
- Homecoming attendance: 847 registrants vs 692 last year (+22%)
Content Strategy for Long-Term Success
Initial launch profiles are table stakes. Sustainable programs require systematic approaches to keep content fresh and relevant.
Annual Content Calendar Template
July-August: Recent Graduate Spotlight
- Feature 10-15 graduates from past 5 years
- Capture early career momentum (promotions, graduate school acceptances, community service)
- Appeals to young alumni who see representation
September-October: Homecoming Campaign
- Highlight 20-year, 30-year, 40-year reunion class members
- Focus on milestone achievements since graduation
- Creates reunion attendance motivation
November-December: Giving Season Recognition
- Feature philanthropic leaders and legacy society members
- Show impact stories (how gifts funded student opportunities)
- Coordinate with year-end giving campaigns
January-February: Academic Excellence
- Spotlight scholars, researchers, faculty members (for universities with emeritus faculty recognition)
- National scholarship winners (Rhodes, Fulbright, Marshall)
- Published authors and thought leaders
March-April: Community Service and Social Impact
- Nonprofit leaders and social entrepreneurs
- Public servants in government, education, healthcare
- Humanitarian award recipients
May-June: Professional Achievement and Industry Leadership
- Business executives and entrepreneurs
- Industry innovators and award winners
- Updates for previously inducted alumni with new achievements
Profile Enhancement Strategies
Multimedia Additions Beyond Launch:
- Audio interviews: easier production than video, effective for storytelling (upload as podcast-style MP3 files)
- Document scans: diplomas, award certificates, historical newspaper clippings add authenticity
- Career timeline visualizations: show professional progression from entry-level to leadership
- Photo galleries: chronological progression from student photos to current professional headshots
- “Where are they now?” updates: annual check-ins with featured alumni about recent projects
User-Generated Content Opportunities:
- Enable alumni self-submission of updates via web form (moderate before publishing)
- Encourage peer nominations: “Know an impressive classmate? Nominate them here”
- Collect advice submissions: “What would you tell current students?” → curate into searchable advice database
- Graduation memory submissions: photos, stories, reflections about time on campus
Seasonal Refresh Practices:
- Review profiles annually for outdated information (job changes, awards, accomplishments)
- Rotate featured profiles on homepage: don’t let same faces dominate for years
- Archive deceased alumni appropriately (in memoriam section with respectful language)
- Update photo quality as higher-resolution images become available
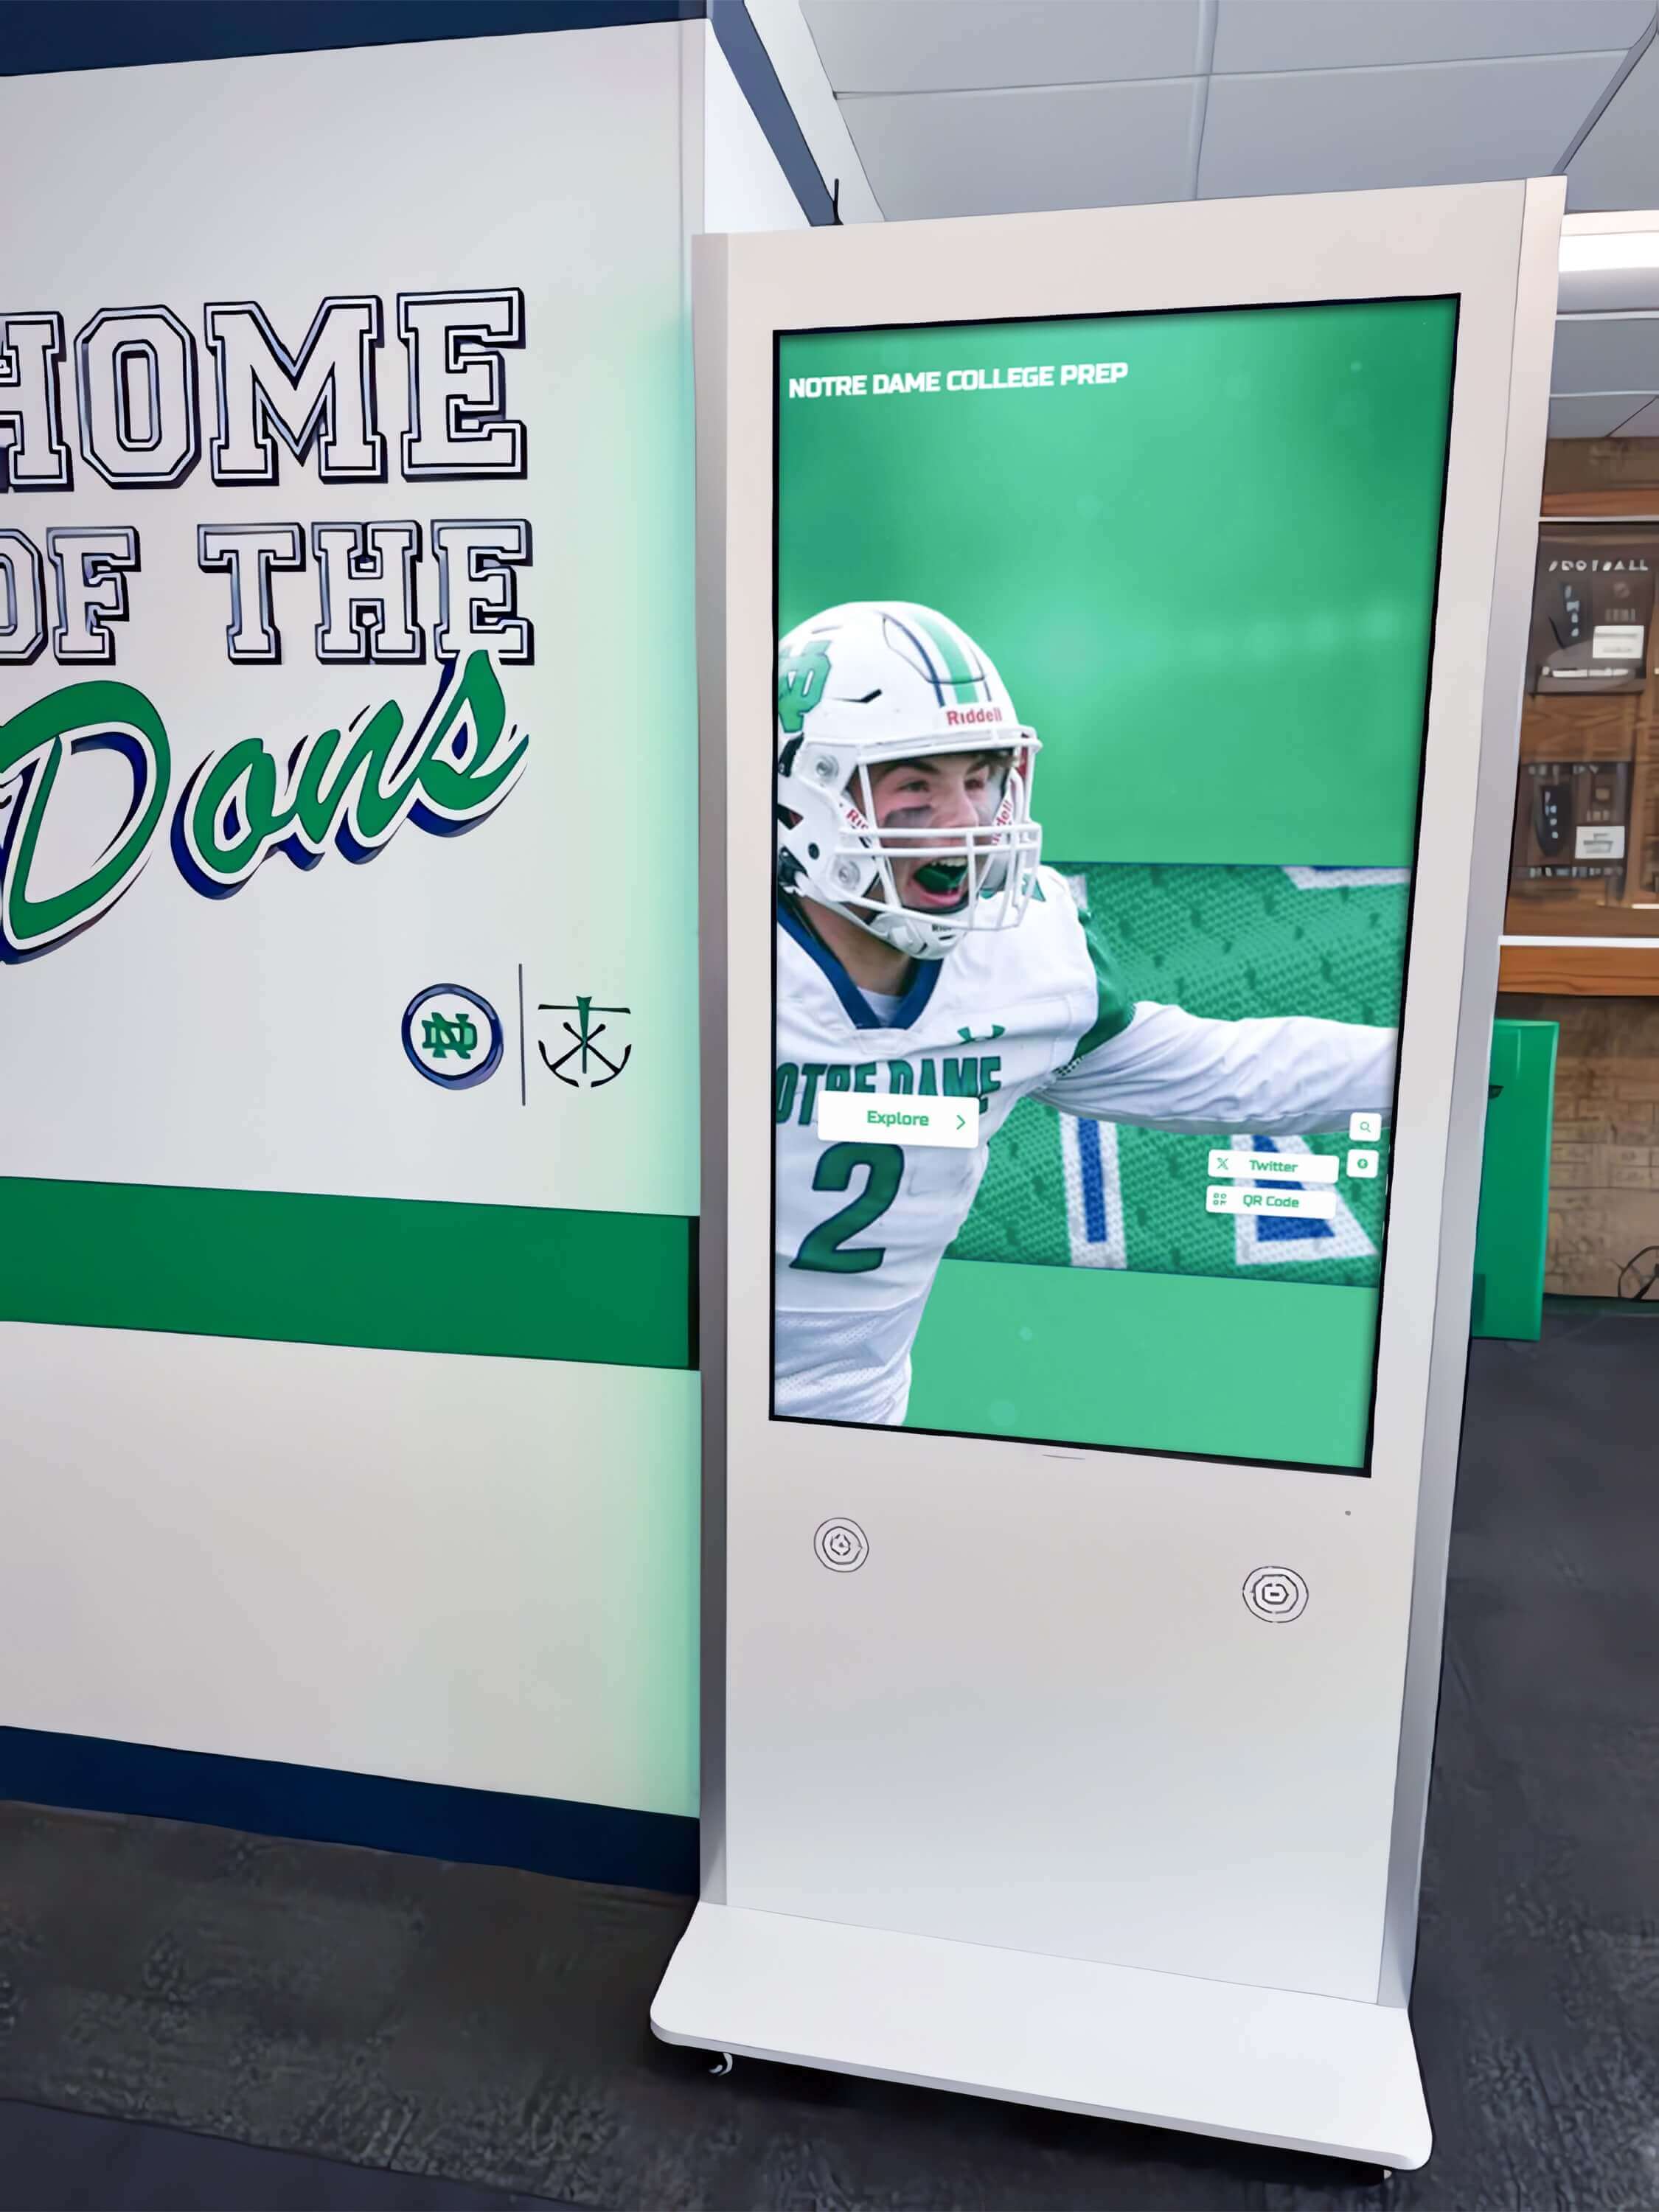
Strategic content planning ensures university alumni walls remain engaging resources rather than static digital monuments
Integration with Advancement Operations
University alumni walls deliver maximum value when integrated with broader advancement strategies rather than functioning as standalone projects.
CRM and Alumni Database Synchronization
Bi-Directional Data Flow:
- Import alumni records from advancement database to pre-populate profile fields (graduation year, degree, contact information)
- Push recognition data back to CRM: flag recognized alumni, track when inducted, capture engagement metrics
- Automatic update triggers: when alumni update employment info on recognition platform, send to database team for CRM update
- Segmentation enhancement: create CRM segments for “alumni featured on recognition wall”—target with specific messaging
Data Mapping Requirements:
- Constituent ID: unique identifier linking recognition platform records to CRM records
- Graduation year and degree data: map academic credentials accurately
- Contact information: email address, phone, mailing address
- Giving history: total lifetime giving, largest gift, most recent gift date (only if integrating donor recognition features)
Privacy and Compliance Considerations:
- FERPA compliance: verify you have appropriate consent to publish educational records
- GDPR/CCPA: provide alumni ability to opt out of public recognition, request data deletion
- Data security: ensure vendor SOC 2 compliance for handling sensitive alumni data
Event Integration Strategies
Reunion Programming:
- Pre-reunion email campaigns: “Explore your classmates’ amazing achievements” with links to class-specific profiles
- On-campus reunion activities: guided tours of recognition displays, scavenger hunts finding classmates
- Digital yearbook recreation: display class composites, historical photos from reunion years
- Live social walls during events: aggregate social media posts tagged with event hashtags
Campus Tour Enhancement:
- Train tour guides to demonstrate interactive displays during prospective student visits
- Create “meet our successful alumni” talking points about featured graduates
- Prospective student takeaways: email links to featured alumni in their intended major
- Parent-specific content: highlight return on investment through alumni career success
Virtual Event Extensions:
- Screen-share recognition platform during virtual alumni events
- Breakout room activities: find classmates from your graduating decade
- Zoom backgrounds featuring alumni wall imagery and institutional branding
- Recording snippets of featured alumni video interviews to intersperse in virtual programming
Fundraising Campaign Applications
Major Gift Prospect Research:
- Alumni wall research surfaces impressive career achievements indicating capacity
- Recognition provides stewardship-appropriate ways to highlight existing donors
- Digital profiles show donors that institutional appreciation extends beyond checks—celebrates holistic contributions
Donor Recognition Tiers:
- Integrate giving levels with alumni achievement recognition (avoid making wealth appear as sole achievement)
- Feature scholarship donors alongside scholarship recipients—complete the story
- Create “impact profiles” showing what donations funded: “Dr. Smith’s gift enabled the research center that launched 50 alumni careers in medical research”
Stewardship Touch Points:
- Email recognized donors annually: “Your profile has been viewed 342 times this year”
- Share usage statistics: “Alumni explore the recognition wall 2,000+ times monthly”
- Provide social media-ready graphics: shareable images of their profile for personal networks
For universities implementing digital donor recognition walls, these systems naturally integrate philanthropic acknowledgment with broader alumni achievement celebration.
Common Implementation Challenges and Solutions
Document these lessons learned to smooth project execution and set realistic stakeholder expectations.
Challenge 1: Inadequate Initial Content Volume
Problem: Launching with 20-30 profiles creates perception of exclusivity rather than celebration, disappointing alumni who expected inclusion.
Solution: Commit to minimum 75-100 profiles before launch. Phased approach:
- Phase 1 (pre-launch): Existing hall of fame inductees + major donors + recent distinguished alumni (target: 100 profiles)
- Phase 2 (3 months post-launch): Add 50 historical profiles researched from archives
- Phase 3 (6 months): Nomination cycle adds 30-40 annually
- Year 2 goal: 200+ profiles providing critical mass
Budget Impact: Additional content development costs $8K-$12K but prevents launch perception problems worth far more.
Challenge 2: Content Updates Fade After Launch Enthusiasm
Problem: Initial dedication to content updates declines after 6-12 months as competing priorities emerge.
Solution: Structure content responsibilities as ongoing job duties, not special projects:
- Assign content updates as 10-15% of advancement coordinator role (documented in job description)
- Schedule quarterly “content days” blocked on team calendars (no meetings, focus on profile updates)
- Create content development dashboard showing profiles needing refresh (last updated >18 months ago)
- Celebrate milestones: “We’ve added 150 profiles this year—only 50 profiles away from 500 milestone!”
Sustainability Tip: Simplify profile creation by accepting varied detail levels. Not every profile requires 500 words and video interview—150-word bio with photo achieves 80% of value at 20% of effort.
Challenge 3: IT Bureaucracy Delays Network Access
Problem: Vendor-provided displays can’t access network due to security policies, device registration requirements, or firewall configurations. Project stalls for weeks awaiting IT approvals.
Solution: Engage IT during initial planning, not during installation week:
- Schedule IT review meeting in Week 3-4 (see implementation timeline earlier)
- Provide vendor-supplied network requirements document detailing ports, protocols, domains
- Pre-register device MAC addresses in network access control systems
- If institutional policies prevent vendor devices on primary network, confirm guest network provides adequate bandwidth/reliability
- Document IT approval in writing before purchase—prevents finger-pointing if issues emerge
Escalation Path: If IT denies network access, document business justification for executive sponsor escalation (advancement VP, CIO joint meeting).
Challenge 4: Physical Space More Constrained Than Initial Assessment
Problem: Installation day reveals obstructions, inadequate mounting surface, or accessibility issues not captured in site assessment photos.
Solution: Conduct on-site vendor walkthrough before purchase, not after:
- Schedule vendor representative to physically visit proposed location
- Contractor or facilities staff present to answer structural questions
- Document any concerns in installation bid (who covers additional costs if fixes needed?)
- Budget 10-15% contingency for unexpected installation challenges
Installation Day Contingency: Identify backup location in case primary location proves infeasible—prevents project halt and wasted equipment.
Challenge 5: User Interface Confuses Visitors
Problem: Visitors touch screen once, can’t find search function, give up. Engagement metrics show average session <45 seconds.
Solution: User experience testing before launch prevents this:
- Recruit 8-10 diverse testers (students, young alumni, older alumni, non-technical staff)
- Observe them using system without guidance—note where they get confused
- Time how long it takes to complete tasks: “Find an alumnus from 1985 who studied engineering”
- Implement fixes before public launch: larger search button, simplified navigation, onboarding tooltip
Post-Launch Iteration: Review usage analytics monthly, look for patterns indicating confusion (high bounce rate, repeated searches for same terms, features never used).
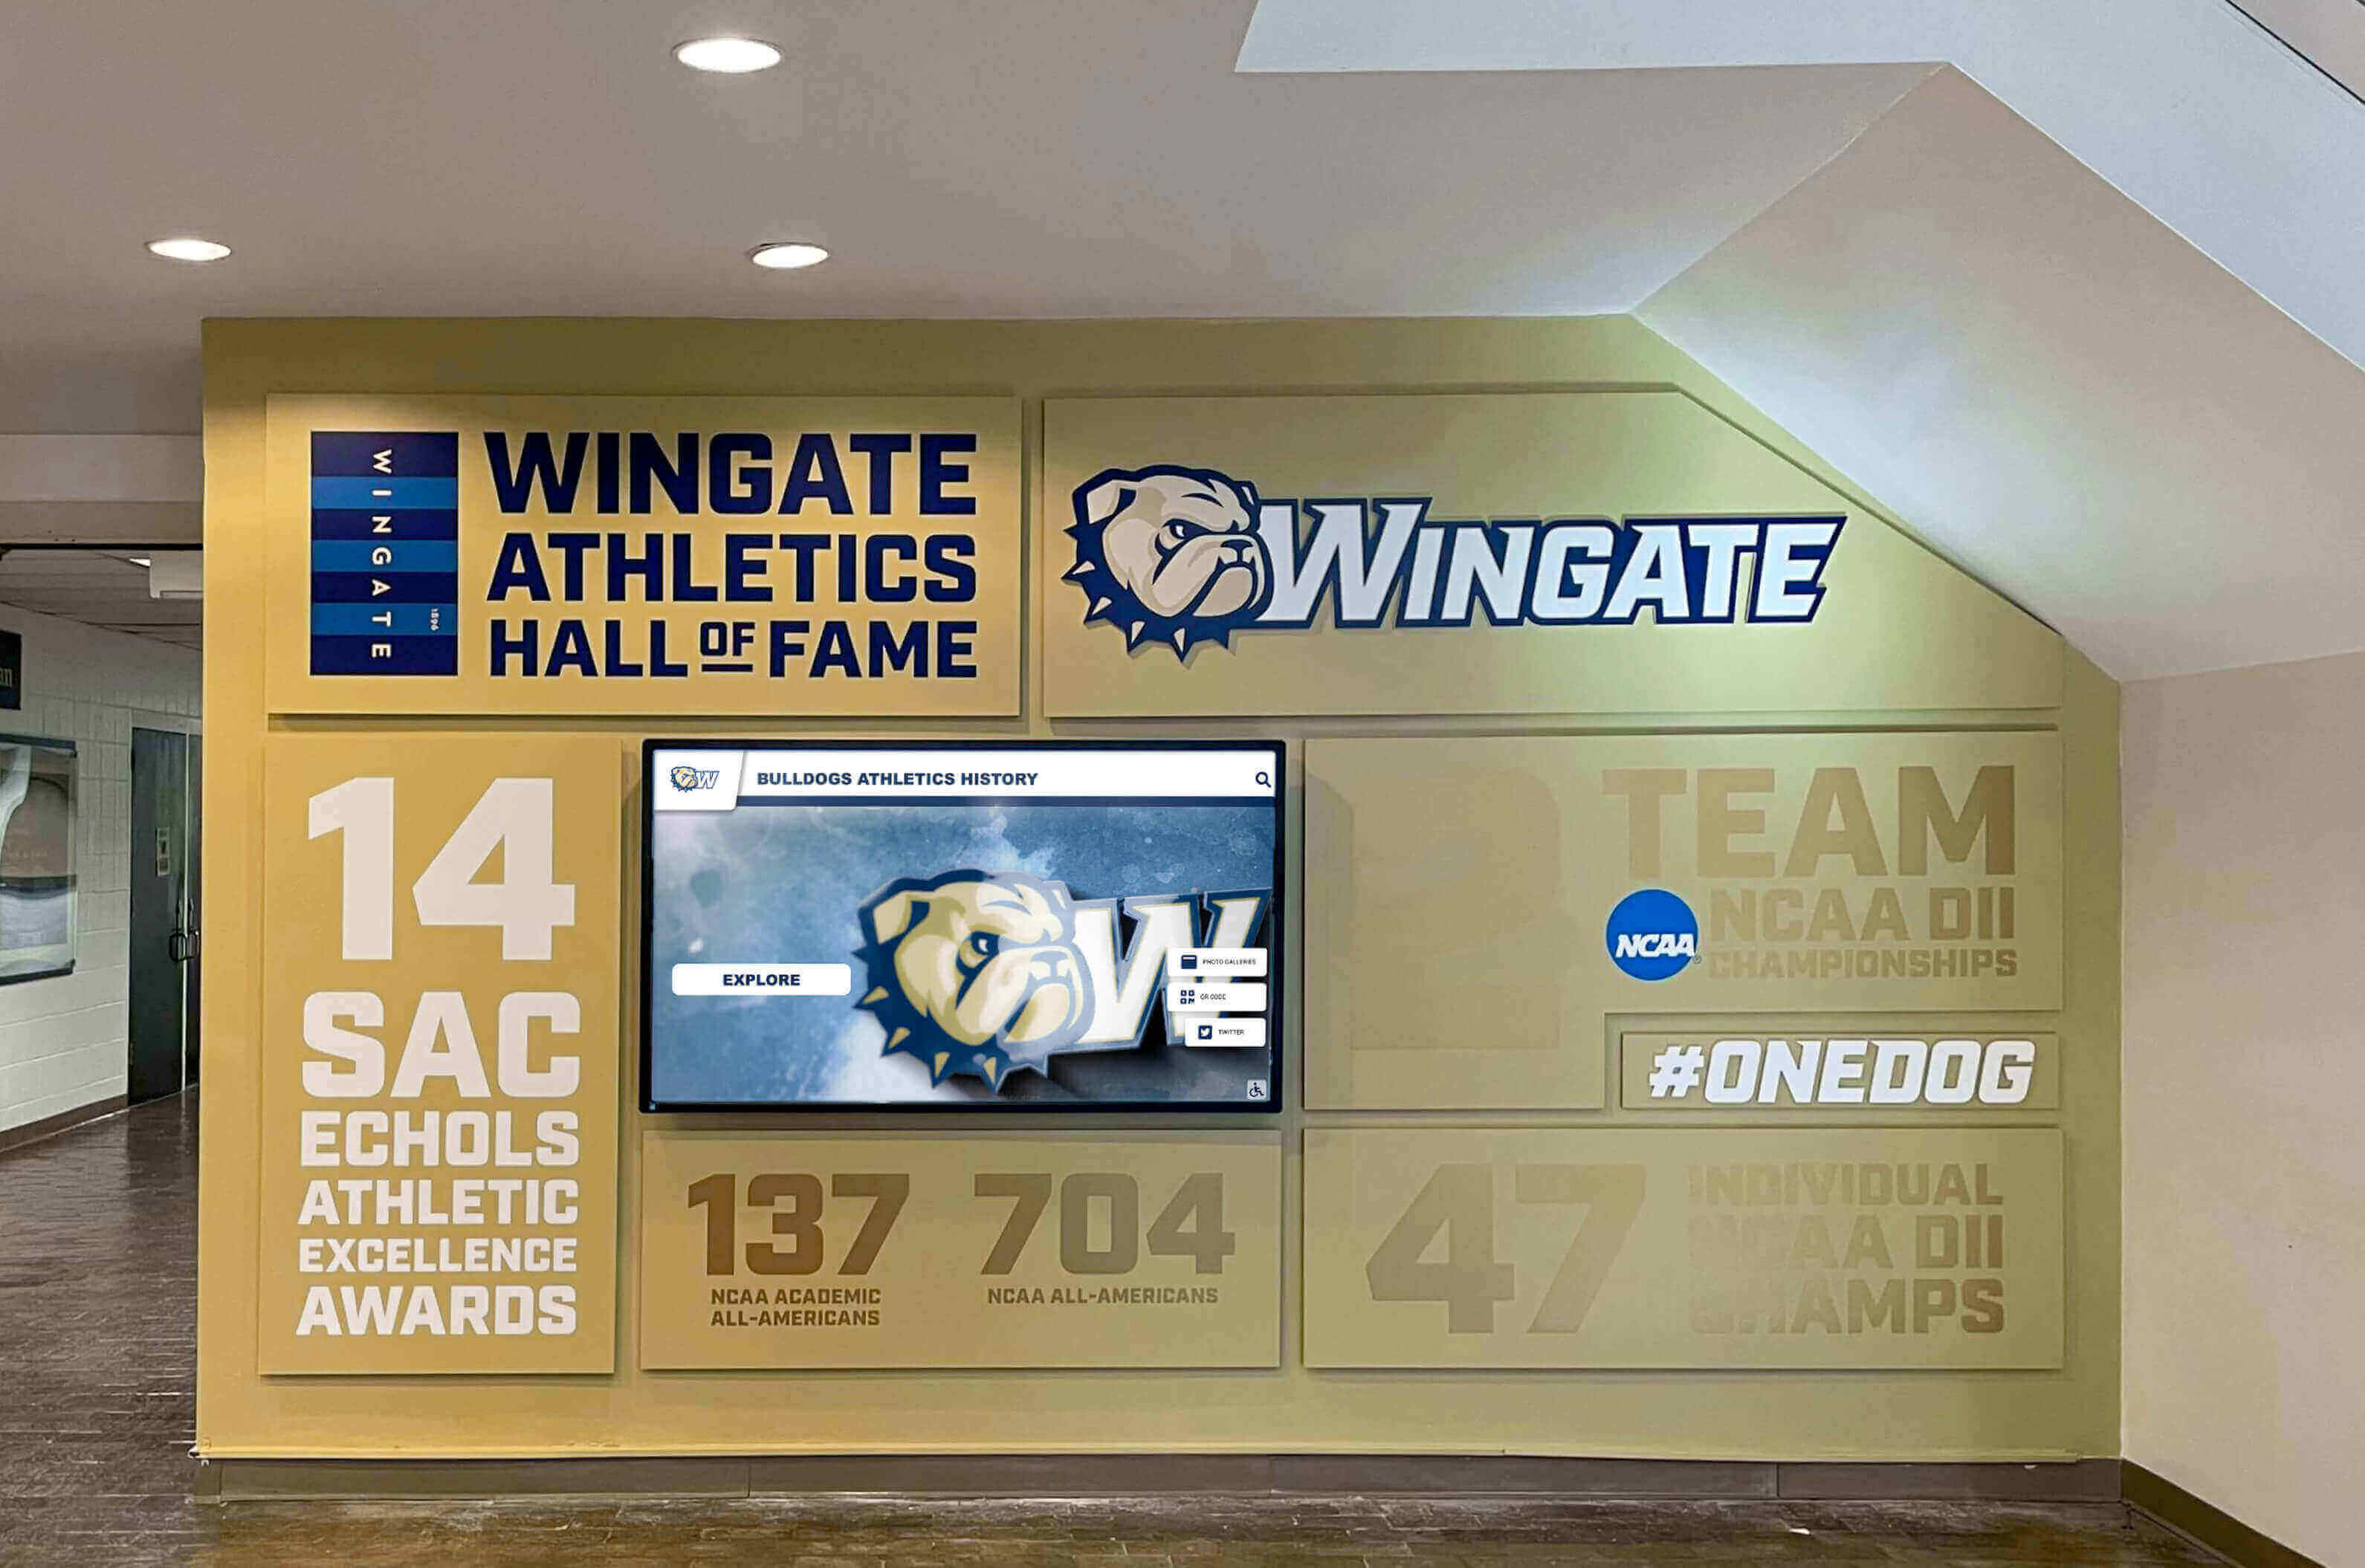
Addressing implementation challenges proactively ensures university alumni walls deliver sustained engagement rather than becoming expensive disappointments
Vendor Evaluation: Questions to Ask Before Committing
Use this checklist during vendor demonstrations and reference calls to identify potential issues before signing contracts.
Technical Capabilities and Reliability
System Architecture:
- ☐ Is platform cloud-based or on-premises? (Cloud strongly preferred for universities with limited IT staff)
- ☐ What is uptime guarantee and SLA? (Expect 99.5%+ with credits for violations)
- ☐ How frequently do you release updates? (Quarterly feature updates typical)
- ☐ Can we test updates in staging environment before production deployment?
- ☐ What is disaster recovery process if servers fail? (Recovery time objective <4 hours expected)
Content Management:
- ☐ Can non-technical staff manage content independently? (Request demonstration from someone who isn’t a sales engineer)
- ☐ Does platform support bulk import from CSV/Excel? (Critical for migrating historical data)
- ☐ Can we create custom fields beyond standard profile templates? (Example: athletics-specific stats, research publications)
- ☐ What are file size limits for photos/videos? (Ensure adequate for high-resolution content)
- ☐ Is there version control allowing rollback of edits?
Integration and Extensibility:
- ☐ Do you have existing integrations with common university CRMs (Salesforce, Blackbaud, EverTrue)?
- ☐ Can you consume data from our SIS (Student Information System)?
- ☐ Is there API access if we want to build custom integrations? (Important for technical universities with in-house development)
- ☐ Can we embed content on our website, or is it only standalone?
Vendor Stability and Support
Company Health Indicators:
- ☐ How many years has your company been in business? (Established vendors reduce platform abandonment risk)
- ☐ How many active higher education clients do you serve? (10+ indicates category expertise)
- ☐ What percentage of revenue comes from higher education? (If <30%, you may not be priority customer segment)
- ☐ May we speak with 3-4 reference customers, including at least one who has used platform 3+ years?
Support Model:
- ☐ What support hours are offered? (Business hours only vs. 24/7 for critical issues)
- ☐ What is guaranteed first-response time for support tickets? (Within 2 hours for critical issues is standard)
- ☐ Is phone support available or only email/chat? (Phone critical for troubleshooting during high-stakes events)
- ☐ Is there additional cost for training beyond initial implementation? (Budget for ongoing training as staff turnover occurs)
Professional Services:
- ☐ What is included in installation? (Expect mounting, network connection, basic configuration)
- ☐ Do you offer content development services if we lack internal capacity? (Cost per profile typically $200-$400)
- ☐ Can you migrate data from existing recognition systems? (Many universities replacing outdated platforms)
Cost Structure and Hidden Fees
Transparent Pricing:
- ☐ What is annual subscription cost, and what is included at that price point?
- ☐ Are there per-user fees for administrator accounts? (Avoid—need multiple trained staff)
- ☐ Are there per-profile fees or storage limits? (Should be unlimited or very high thresholds)
- ☐ What triggers price increases—annual inflation adjustment or usage-based thresholds?
Additional Costs to Clarify:
- ☐ Is training included, and how many sessions? (Expect 2-3 sessions included)
- ☐ Are software updates included in annual subscription or separately charged?
- ☐ If we add displays in years 2-3, is there per-display licensing fee?
- ☐ What are costs for optional features like custom development or mobile apps?
Exit Strategy and Data Portability
Long-Term Flexibility:
- ☐ What is contract term and renewal process? (Avoid multi-year commitments before validating platform)
- ☐ If we discontinue service, can we export all content? (In what formats? JSON, CSV, raw media files?)
- ☐ Who owns content and media uploaded to platform? (Ensure university retains all rights)
- ☐ Do displays continue functioning if we stop subscription, or do they go dark? (Understand leverage dynamics)
Case Study: Mid-Sized Public University Implementation
This anonymized real-world example illustrates how planning decisions and implementation tradeoffs play out at a typical institution.
Institution Profile:
- 18,000 students (15K undergraduate, 3K graduate)
- 65,000 living alumni across 110-year history
- Alumni relations staff: 8 FTEs supporting engagement, events, communications, advancement
- Annual advancement budget: $1.2M (modest compared to large research universities)
- Existing recognition: Outdoor donor plaza with engraved bricks (1,200 donors), trophy cases in athletics facilities
Project Drivers:
- Upcoming capital campaign requiring enhanced donor stewardship
- Aging alumni population prompting urgency to document achievements before passing
- Student recruitment challenge—needed to demonstrate career outcomes more effectively
- New student union construction providing prime physical location for recognition display
Project Scope Decisions:
Option A: Traditional Expanded Donor Wall
- 30×8 foot donor wall with engraved names
- Capacity: 2,000 names at current sizing
- Cost: $85K for wall construction + $120/name for engraving = $320K total
- Timeline: 9 months for design, fabrication, installation
Option B: Interactive Digital Recognition System (Selected)
- Two 65" touchscreen displays: student union + alumni center
- Cloud-based CMS with unlimited profile capacity
- Web platform extension for remote access
- Cost: $42K initial (hardware, software, installation, training) + $8K annually
- Timeline: 16 weeks from kickoff to launch
Decision Rationale: Digital system cost 87% less initially, accommodated unlimited future growth, told richer stories than engraved names, and provided measurable engagement analytics. Board member concern about “what if technology becomes obsolete?” addressed through documented total cost of ownership over 10 years: $122K (initial + 10×$8K) vs. $320K for traditional wall with no expansion capacity.
Implementation Journey:
Weeks 1-6: Planning
- Advancement VP championed project, secured $45K capital budget allocation
- Formed committee: assistant director of alumni relations (project lead), IT network engineer, student union facilities manager, advancement communications coordinator
- Site assessment revealed: excellent student union location near main entrance, existing CAT6 network drop within 20 feet, adequate power, strong WiFi backup
- Requirements prioritized: ease of content management above all else, ADA compliance, mobile-responsive web platform
Weeks 7-10: Vendor Selection
- Evaluated 4 vendors (2 higher ed specialists, 2 generic digital signage platforms)
- Selected Rocket Alumni Solutions based on: purpose-built CMS for alumni recognition, strong higher ed reference base, 99.7% uptime track record, white-glove implementation support
- Negotiated: 2-display discount, 5-year subscription rate lock, 40 hours included content development consulting
Weeks 11-16: Content Development
- Identified initial 120 profiles: 40 existing hall of fame inductees, 30 major donors ($25K+ lifetime giving), 30 distinguished recent alumni (<15 years), 20 historical figures
- Created streamlined questionnaire capturing: biographical data (200 words), career highlights (bulleted list), advice for students (3 sentences), photo submission (professional headshot preferred)
- Achieved 75% response rate (90 of 120 submitted content)
- Staff wrote profiles for 30 non-responders using public information (LinkedIn, news articles, alumni magazines)
- Commissioned video interviews with 8 featured alumni visiting campus for events (lower cost than traveling to film)
Weeks 17-20: Installation and Testing
- Hardware installed during spring break (minimal student disruption)
- Minor issue: display positioning too high for wheelchair users—remounted 6 inches lower per ADA compliance review
- Content imported via CSV, final QA review corrected 14 typos and 3 incorrect graduation years
- Usability testing with 12 volunteers revealed: search button not prominent enough (UI adjusted), video auto-play annoying (changed to click-to-play)
Weeks 21-24: Launch
- Soft launch 2 weeks before formal unveiling—encouraged feedback, identified 6 minor bugs
- Unveiling ceremony during homecoming with 200+ attendees including 8 newly inducted hall of fame members
- Press release generated local TV coverage (3-minute segment highlighting interactive technology)
- Email campaign to 42K alumni with valid addresses (18% open rate, 4.2% click-through to web platform)
Results After 18 Months:
Engagement Metrics:
- Physical displays: 2,400 monthly sessions (average 4m 15s duration)
- Web platform: 1,850 monthly unique visitors (62% from non-campus IPs)
- 287 alumni self-submitted updated career information via web form
- 156 social media shares of individual profiles
Advancement Impact:
- Giving participation from recognized alumni: 22.3% vs. 14.1% institutional average (58% lift)
- 9 major gift conversations initiated through recognition research surfacing capacity
- Reunion attendance increased 31% year-over-year (recognized alumni more likely to attend)
- Database improvements: 340 email addresses updated, 280 employment records added
Operational Efficiency:
- Content updates require 3-4 hours monthly (assistant director can manage without IT support)
- Annual induction cycle adds 25-30 profiles without physical space constraints or costs
- Video production evolved: now using student workers with iPhone 14 Pro and $400 lighting kit (5% of initial professional production costs)
Lessons Learned:
- “We should have launched with 150 profiles instead of 120—took 6 months to reach critical mass feel”
- “Video interviews are powerful but time-consuming—audio-only interviews with static photos work nearly as well for 1/10th the effort”
- “Integration with CRM took 8 months longer than expected due to bureaucracy—plan early”
- “Students use the displays way more than we anticipated—career exploration angle was underestimated”
Conclusion: Transform Recognition Into Strategic Infrastructure
University alumni walls represent far more than digital decoration. When implemented with operational rigor, these systems become strategic infrastructure that measurably strengthens advancement outcomes, preserves institutional history, and inspires current students through authentic career examples.
The specifications, calculators, and implementation frameworks in this guide translate abstract concepts into concrete deliverables. Before your next procurement committee meeting, you’ll document exactly what your campus needs: 65" 4K touchscreen with PCAP technology, wall-mounted at 48" center height with CAT6 network drop and dedicated 15A circuit, managed through WCAG 2.1 AA compliant cloud CMS accessible via HTTPS on your guest VLAN.
Your vendor conversations shift from “tell me about your product” to “here are our requirements—confirm your platform addresses items 1-27.” Your leadership proposals include total cost of ownership calculations, engagement metric baselines, and advancement impact projections grounded in peer institution data.
For universities ready to specify and implement comprehensive alumni recognition infrastructure, solutions like Rocket Alumni Solutions provide purpose-built platforms refined through hundreds of higher education deployments. From technical requirements documentation through years of content strategy optimization, the right implementation partner accelerates timelines while avoiding costly mistakes that force expensive corrections.
Ready to Build Your University Alumni Wall?
Get a free TouchWall implementation guide customized for your institution, including site assessment templates, budget calculators, and technical specification checklists. Schedule a consultation to review your specific requirements and receive a detailed implementation roadmap.
Book a TouchWall Build SessionUniversities investing in alumni recognition infrastructure make decade-spanning commitments. Detailed requirements planning, realistic budget expectations, and systematic implementation approaches separate successful projects that deliver sustained value from expensive disappointments gathering dust in unused lobbies. Your alumni have achieved remarkable things—ensure your recognition system tells their stories with technical excellence that matches their accomplishments.